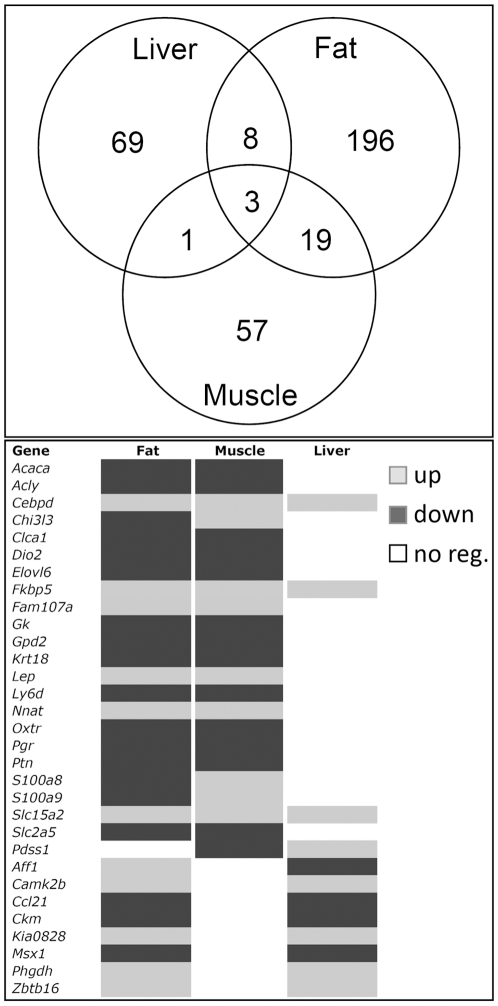
Figure 2. Overlap in the expression of UAG regulated genes amongst tissues of Ghsr KO mice.
The largest intersecting set occurs between fat and muscle with 22 genes (Venn diagram). These genes tend to be regulated in the same direction in both tissues (18 of 21, heat map on right) and include genes that encode key regulatory enzymes in lipid and carbohydrate metabolism, such as Acaca and Acly. Intersects between fat and liver, and muscle and liver consist of much smaller gene sets, but include Camk2b, Ckm, Phgdh and Zbtb16, which have all been linked with regulation of energy homeostasis and metabolic syndrome.

