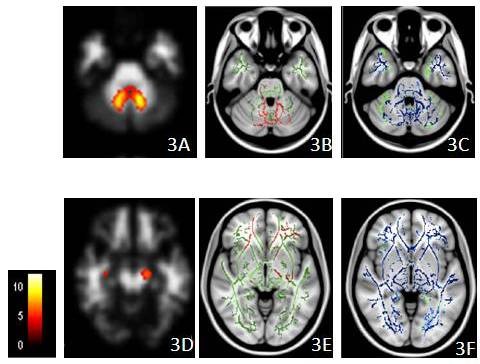
Figure 3.

Clusters with atrophy and white matter changes. Clusters with atrophy by voxel-based morphometry (VBM) (3A and 3D), reduced fractional anisotropy (3B and 3E in red) and increased mean diffusivity (3C and 3F in blue) in the patient group overlaid on the mean skeleton map (in green) (all p < 0.05, corrected at the cluster level). The colored bar indicates the t value in the VBM study. The peri-dentate region and left cerebral peduncle are the two regions that show overlapping across three measurements, while the MD changes are more extensive.
