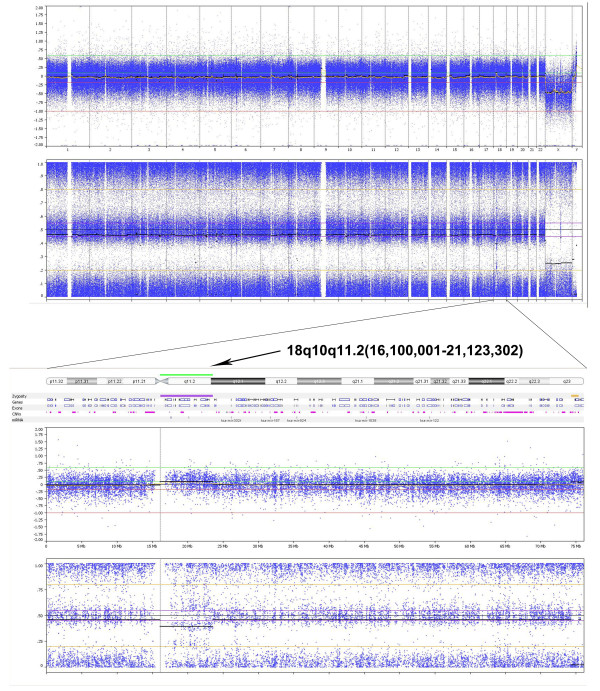
Figure 3.
Whole genome analysis using SNP arrays on peripheral blood derived patient DNA. An Illumina 610 quad array indicated a ~5 Mb gain of the pericentromeric region of 18q10q11.2(16,100,001-21,123,302). The upper panel shows the array results for the whole genome, while the lower panel shows the results obtained for chromosome 18. The green bar and arrow indicate the amplified region. On the X-axis the chromosomes and chromosomal region are indicated. The upper Y-axis shows the Log2 R ratio and the lower Y-axis indicates the B allele frequency.

