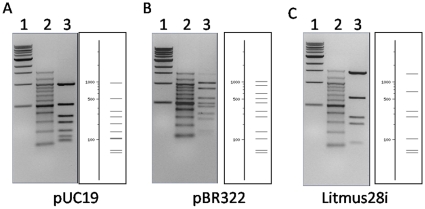
Figure 3. The digestion patterns of BtsI-1 on different substrates:
1 µl of BtsI-1B (∼1.8 µM) was mixed with 1 µl of BtsIA and then digested 0.6 µg pUC19 (A), pBR322 (B) and Litmus28i (C) in NEB4 at 55°C for 1 hour. In each figure, Lane 3 in the left panel is the actual digestion pattern and the right panel is the theoretical digestion pattern generated by NEBcutter V2.0. Lane 1: 1 Kb DNA Ladder (NEB #N3232); Lane 2: 100 bp DNA Ladder (NEB #N3231).

