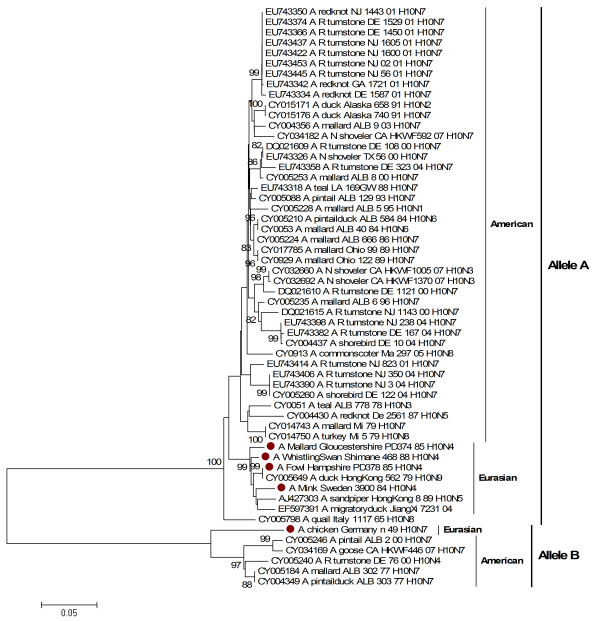
Figure 3.
Phylogenetic relationship between NS1 genes of H10 influenza A viruses. The protein coding region tree was generated by neighbour-joining analysis with the Tamura-Nei γ-model, using MEGA 4.0. Numbers below key nodes indicate the percentage of bootstrap values of 2000 replicates. Isolates sequenced in this study are indicated by a red dot.

