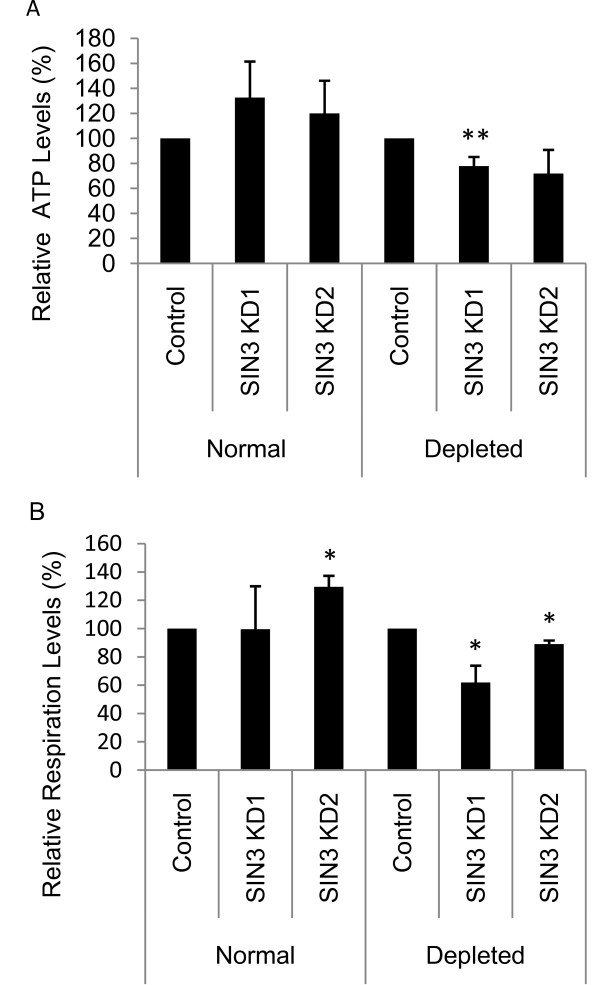
Figure 3.
ATP levels and respiration are affected in S2 cells following loss of SIN3 in nutrient depleted conditions. (A) ATP levels of S2 cells grown in normal or depleted media with and without SIN3. Error bars represent standard error (n = 3-5). **p = 0.02. ATP present in whole cell extracts prepared from control and SIN3-deficient cells was quantified using the bioluminescent method. (B) Relative respiration levels in S2 cells grown in normal or depleted media with and without SIN3 (n = 3). Error bars represent standard error. *p < 0.05.

