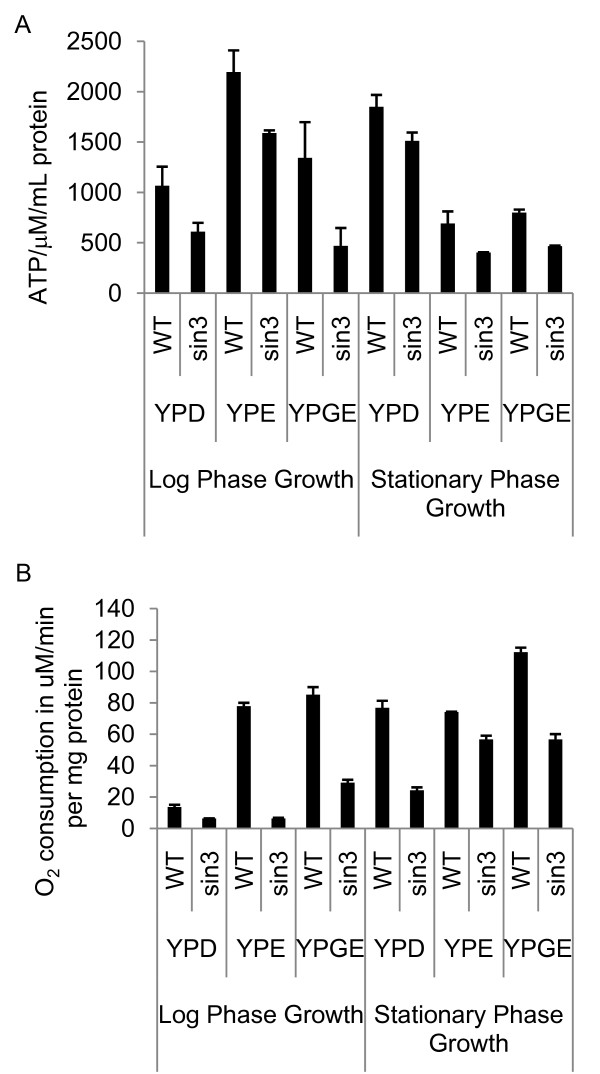
Figure 5.
ATP levels and respiration are decreased in yeast sin3 null mutants. (A) ATP levels of yeast grown in YPD and non-fermentable carbon sources measured as ATP/μM/mg protein. Error bars represent standard error (n = 3). ATP present in whole cell extracts prepared from control and SIN3-deficient yeast was quantified using the bioluminescent method. (B) Respiration levels of yeast grown in YPD and non-fermentable carbon sources measured as O2 consumption in μM/min per mg of protein. Error bars represent standard deviation.

