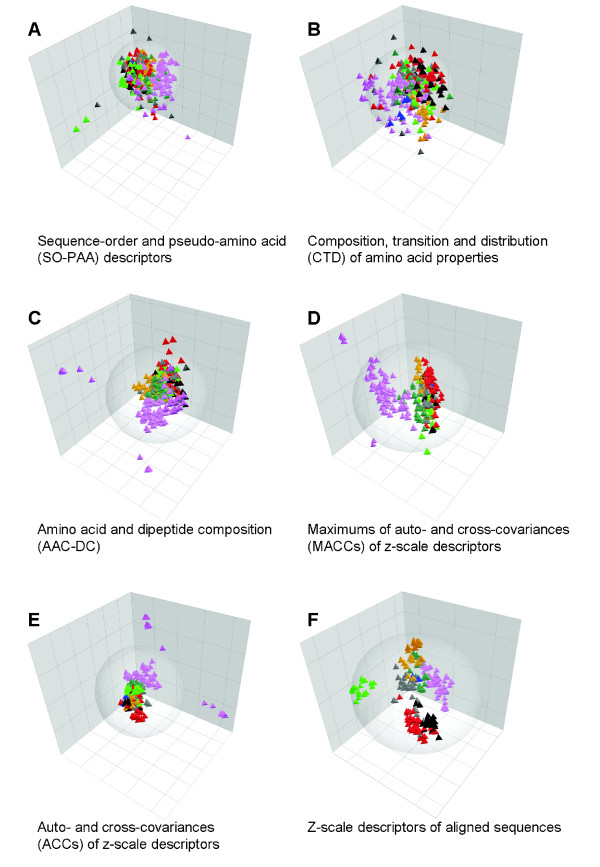
Figure 1.
Plots representing the separation of kinase groups in the three first components of PCA models. Panels A-F show results of six PCA models using various types of alignment independent (A-G) and alignment based (F) kinase descriptions. Each one of the 317 protein kinases is represented by a tetrahedron, color-coded according to its belonging to a kinase group: black, AGC (named after member families PKA, PKG and PKC); red, CAMK (calcium/calmodulin regulated kinases); blue, CK1 (casein kinases); electric green, CMGC (named after member families CDK, MAPK, GSK3, and CLK); orange/amber, STE (homologues of yeast Sterile kinases); magenta, TK (tyrosine kinases); sea green, TKL (tyrosine kinase-like kinases); gray, atypical/other. Note that in Panels A and B kinase groups do not form distinct clusters, whereas in the other panels the largest kinase groups are clearly separated.

