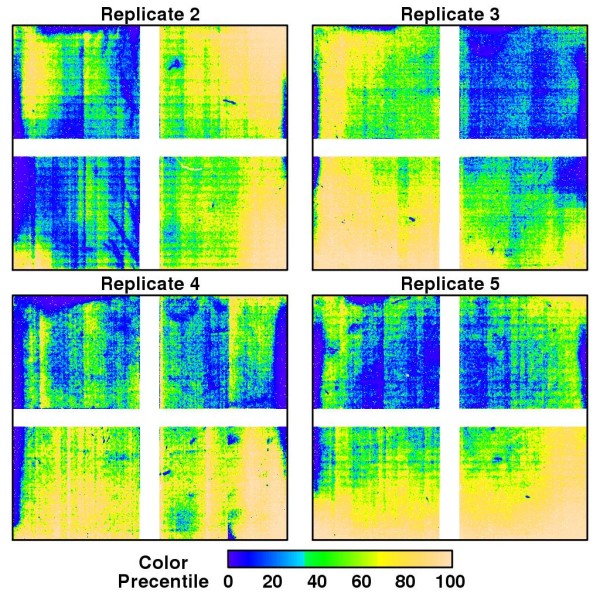
Figure 3.

Image plots of Ŝxy for the replicated chips (Set 1). The image of the first array in Set 1 is shown in Figure 2c. Medians (IQR) of arrays 2-5 are -0.0001 (-0.0303, 0.0273), -0.0031 (-0.0294, 0.0279), -0.0013 (-0.0201, 0.0237) and -0.0064 (-0.0316, 0.0269), respectively.
