Figure 2.
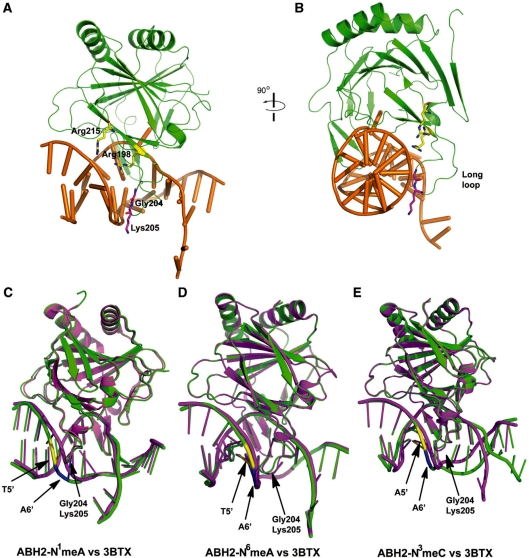
Interaction of ABH2 protein to the dsDNA backbone. (A) Cartoon diagram of the ABH2–DNA1 complex with N1-meA. The protein is shown in green, DNA in gold, Arg198 and Arg215 in yellow and two residues on the loop (Gly204, Lys205) in magenta. (B) Same structure as in (A), rotated 90° to the right to show the side view of the residues and dsDNA. (C) Overall superposition of ABH2–N1-meA complex with 3BTX to show the backbone distortion caused by N1-meA. ABH2–N1-meA complex in green with backbone of T10' in yellow and A9′ in blue. 3BTX in magenta. (D) Overall superposition of ABH2–N6-meA complex with 3BTX to show the backbone distortion caused by N6-meA. The color coding is same as in (C). (E) Overall superposition of ABH2–N3-meC complex with 3BTX to show the backbone distortion caused by N3-meC. Same color coding in (C) is used.

