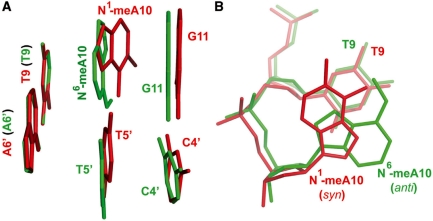
Figure 6.
Structure comparison of N1-meA:T lesion with N6-meA:T base pair. (A) Side view structure of N1-meA10:T5′ with neighboring base pairs aligned with N6-meA10:T5’. N1-meA10:T5′ with neighboring base pairs appears in red, and N6-meA10:T5′ with neighboring base pairs in green. The figure illustrates a significant dihedral between N1-meA10 and N6-meA10 when two bases are overlaid together. (B) Overlay of N1-meA10 and adjacent T9 (in red) with N6-meA10 and neighbor T9 (in green) as viewed from top. The purine ring of N1-meA10 is in syn conformation, and the N6-meA10 base is in anti-conformation.

