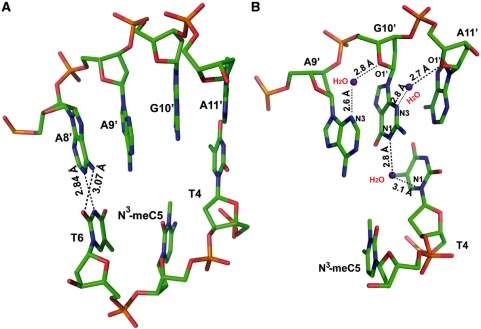
Figure 8.
Structure of dsDNA2 with N3-meC lesion opposite with G and its flanking base pairs. (A) Side view of N3-meC5 lesion complementary with G10′ and neighboring base pairs. Atoms are colored as follows: carbon, green; nitrogen, blue; oxygen, red; phosphate, orange. A Wobble base pairing between T6 and A8′ is shown in place of the Watson–Crick base-pairing of T6 with A9′. Black dotted lines represent hydrogen bonds. (B) Interactions between G10′ with the neighboring nucleotides help unpaired G10′ and A9′ stay intrahelical. Atoms are in same color coding as (A) with water in purple.

