Figure 5.
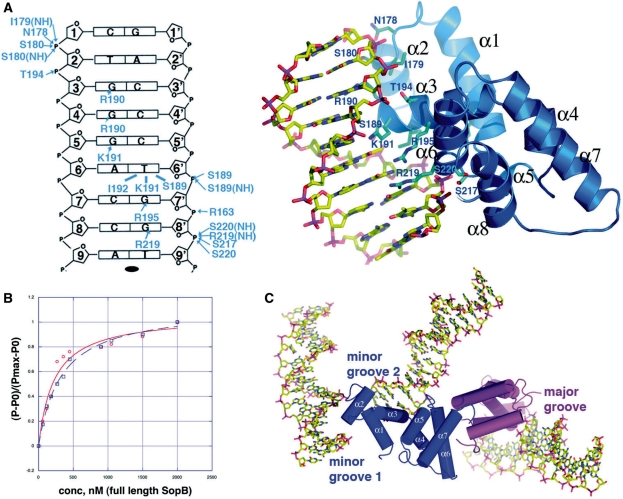
SopB–DNA interactions. (A) Left, schematic representation of SopB–DNA interactions. Only one half site of the 18-mer duplex is shown as the identical contacts are made to each half site. The strands are labeled 1–9 and 1′–9′ (where ′ indicates other strand of the duplex). Bases are represented as rectangles and labeled according to sequence. The ribose groups are shown as pentagons. Hydrophobic contacts are indicated by lines and hydrogen bonds, by arrows. Right, close up of the SopB–DNA specific major groove interactions that are made to each half site and indicated schematically. Interacting residues are shown as blue sticks and the secondary-structural elements are labeled. (B) Fluorescence polarization DNA-binding isotherms comparing SopB binding to the 43- and 18-mer centromere sites. Each data set was normalized, and normalized polarizations were plotted along the y-axis against the protein concentrations, which are plotted along the x-axis. (C) Close up of the triple bridging interaction that is comprised of specific and non-specific SopB–DNA found in the P3121 crystal form. Specifically, this dimer is the one that is also colored blue and magenta in Figure 1C. The blue subunit makes non-specific minor groove contacts to two DNA duplexes while the magenta subunit makes the canonical major groove contacts indicated in Figure 5A and found in all the subunits of the crystals except the P3121 blue subunit.

