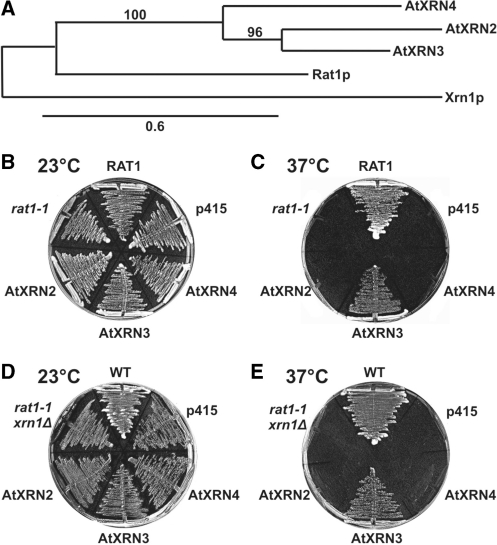
Figure 7.
(A) Bootstrapped neighbour-joining phylogram representing evolutionary relationships between yeast Rat1 and Xrn1, and Arabidopsis AtXRN2, AtXRN3 and AtXRN4 nucleases. Bootstraps values are indicated along the branches. The scale bar shows the evolutionary distance (amino acid substitutions per site). (B–E) Complementation tests of the temperature sensitive phenotypes of rat1-1 (B and C) and rat1-1, xrn1Δ (D and E) yeast strains by AtXRN2, AtXRN3 or AtXRN4 expressed from a low copy p415TEF plasmid. RAT1, control strain containing the wild-type RAT1 allele; p415, strain containing an empty p415TEF vector; WT, wild-type strain. Plates were incubated at 23°C (B and D) or 37°C (C and E).

