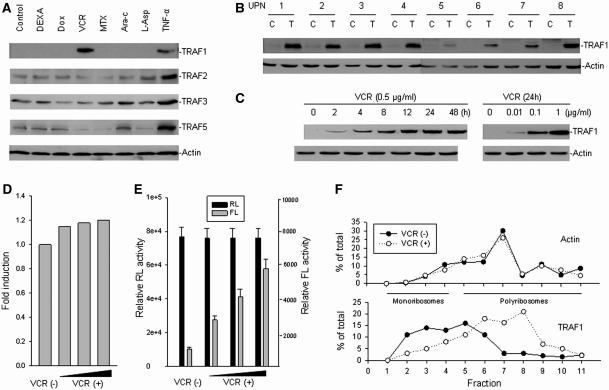
Figure 4.
Induction of TRAF1 translation by vincristine in cancer cells. (A) Fresh isolated leukemic cells from an ALL patient was treated with 1 µg ml−1 DEXA, 0.5 µg ml−1 Dox, 0.5 µg ml−1 VCR, 0.5 µg ml−1 MTX, 0.5 µg ml−1 Ara-c, 1 IU/ml L-Asp and 0.05 µg ml−1 TNF-α, respectively, for 24 h. The protein expression for different TRAFs was examined by western blot analysis. (B) Fresh leukemic cells from eight ALL patients (UPN, unique patient number) were incubated with 0.5 µg ml−1 VCR for 24 h (T). The expression of TRAF1 in each was detected by western blot assay as compared with untreated cells (C). (C) Time- and dose-dependent induction of TRAF1 protein expression in ALL cells treated with VCR. Leukemia cells from UPN 1 were treated with 0.5 µg ml−1 VCR for different times or with VCR for 24 h at different doses, as indicated. Protein expression was examined by western blot. (D) mRNA expression levels of TRAF1 after treatment with or without increasing concentrations (0.01, 0.1 and 1 μg ml−1) of VCR in Raji cells, as determined by quantitative RT–PCR. (E) Transfection and reporter assay for the effect of VCR on TRAF1 IRES activity. Raji cells were transfected with 5 µg pRL-392-FL plasmid containing TRAF1 IRES from −392 to −1 fragment and treated with or without increasing concentration (0.01, 0.1 and 1 μg ml−1) of VCR. Data represented the mean ± SD of RL and FL activities in at least three independent experiments. (F) Raji cells were treated with or without 0.5 µg ml−1 VCR for 24 h, and cytoplasmic lysates were fractionated on sucrose gradient. RNA was extracted from each of the fractions and subjected to quantitative RT–PCR for quantitative analysis of the distribution of TRAF1 and Actin mRNAs. Data represent percentage of the total amount of corresponding mRNA on each fraction.

