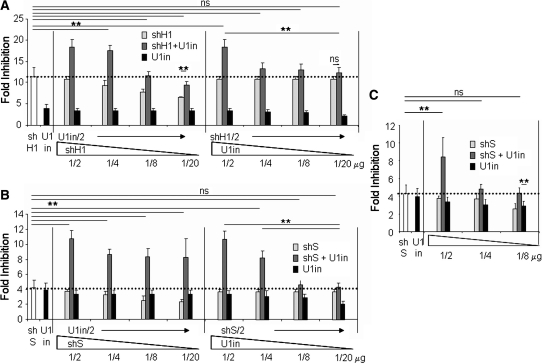
Figure 5.
Increased inhibition observed by combination of U1i and RNAi allows the effective dose of inhibitors to be decreased. Luciferase activity was measured in HeLa cells transfected with a plasmid that expresses Firefly luciferase and a control plasmid or the amount of plasmids expressing luciferase inhibitors indicated at the bottom of the graph. Inhibitors were U1inαLuc, and shH1 (A) and shS (B and C) alone or a combination of U1inαLuc and shαLuc. The fold inhibition is indicated for each case. A horizontal dotted line serves to mark the best fold inhibition obtained with the best inhibitor (either a shRNA or a U1in) on its own. Error bars show standard deviations of nine different experiments. Note that the scale is different for each figure.

