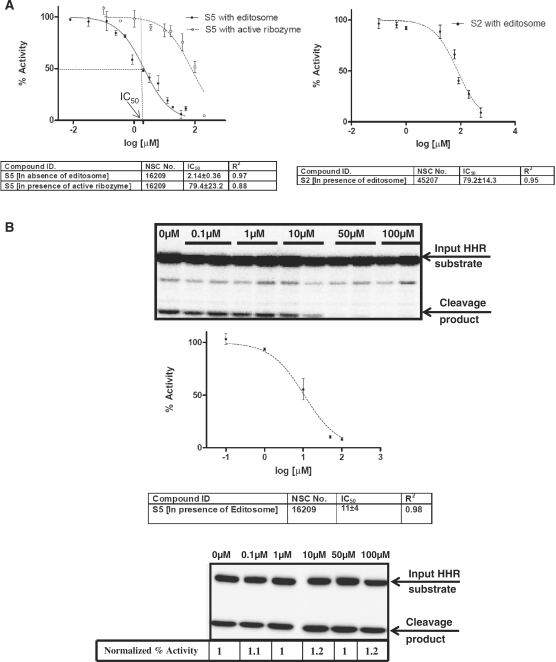
Figure 6.
Effects of known inhibitors of RNA ligase on editosome. (A) Dose–response curves for S5 in the presence of editosome (solid line, close circle, left panel) and in the absence of editosome in the presence of active ribozyme (dashed line, open circle, left panel), and S2 in the presence of editosome (dashed line, close circle, right panel). IC50 and R2-values are reported based on three independent FRET-based full-round editing assays using editosome purified from cells expressing TbREL1-TAP. The IC50 ranges are reported with 95% confidence level. The concentration of S5 that results in 50% inhibition of maximal activity (IC50) is indicated in left panel. (B) The effect of S5 on RNA editing using radiolabel-based HHR assay. Drug concentrations in micromolars have been indicated. The dose–response curve obtained from duplicates for S5 in presence of tap-tag purified editosome has been shown. The IC50 range is determined based on 95% confidence level. The bottom panel shows the effect of drug on active A6Rbz/gA6Rbz in the absence of editosome. The percent cleavage activity (normalized percentage activity) of active ribozyme in the absence of S5 was assumed to be 1 and percent cleavage at the higher concentrations of S5 (0.1, 1, 10, 50 and 100 µM) was accordingly normalized.

