
Figure 3. CYP2A6*23 decreased the rates of nicotine metabolism in vivo, as measured by the 3HC/COT ratio.
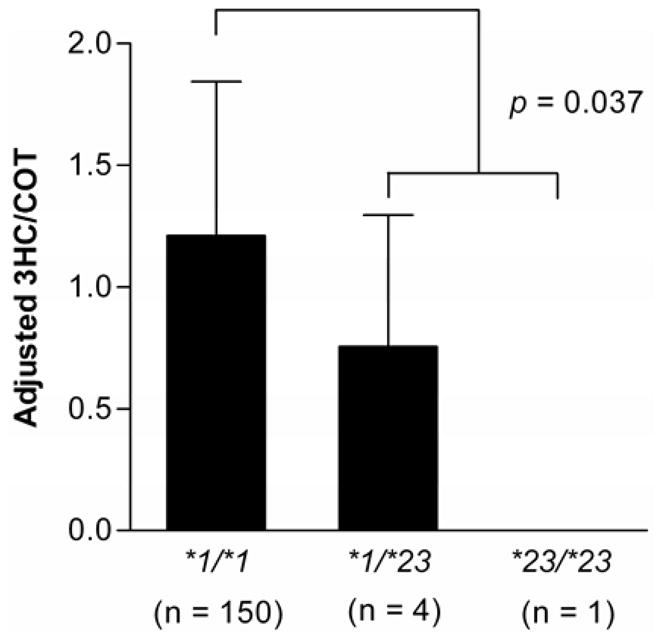
The number of individuals in each genotype group is shown in parentheses on the x-axis. The data is presented as mean ± SD. Individuals with other CYP2A6 genetic variants (CYP2A6*2, *4A & D, *9, *12, *14, *15, *17, *20, *21, *24, *25, *26, *27, *28, *29) were excluded from the wildtype and CYP2A6*23 genotype groups.