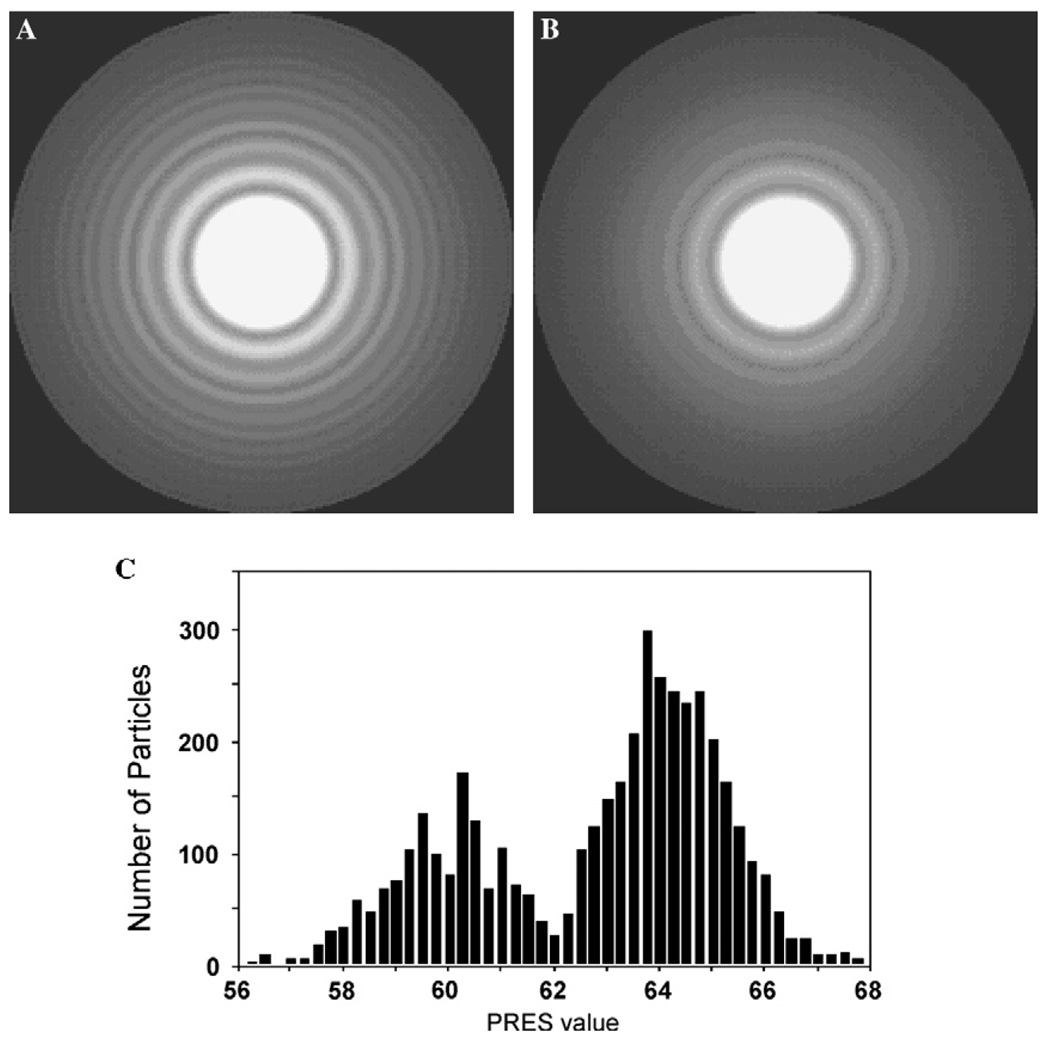
Fig. 2.
Rotationally averaged summation of Fourier power spectra of all boxed out particles from (A) a “good” micrograph and (B) a micrograph with limited resolution. The outer ring corresponds to a spatial frequency of 1/10 Å−1. (C) Distribution of PRES values of aligned clathrin particles. Peak I and peak II include 1460 and 3790 particles, respectively. The particles in peak I have lower PRES values and are therefore more similar to the reference model.

