
Fig. 5.
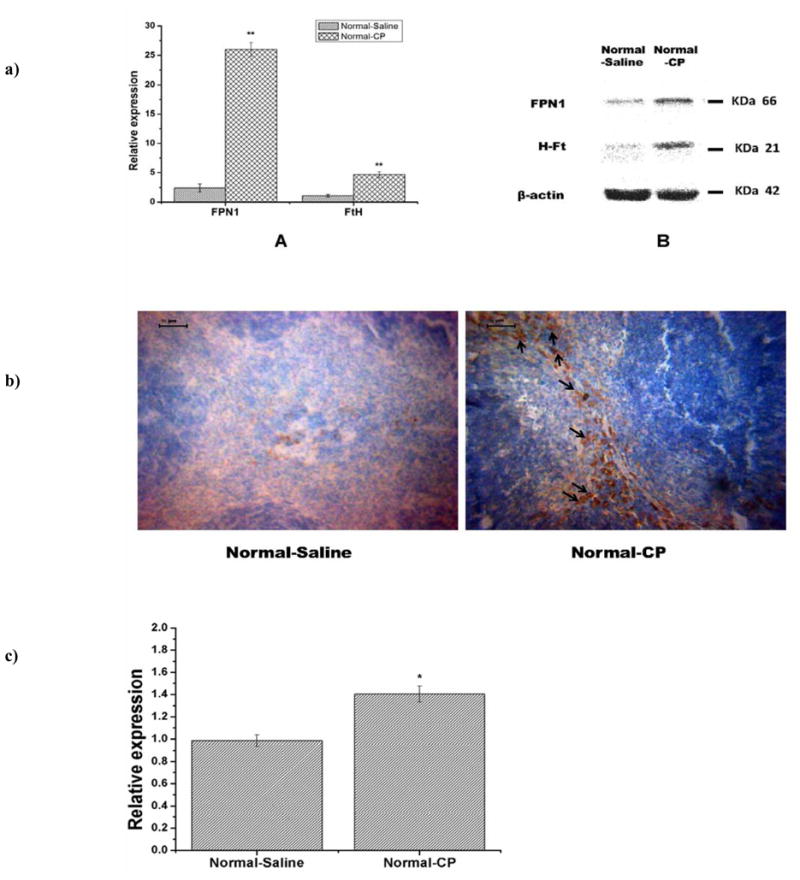
a). Expression of FPN1 and Ferritin-H were measured at transcriptional and translational levels. Expression of FPN1 and FtH increased significantly in spleen of normal mice with cisplatin treatment for 14 days. (A) Quantitative measurement of FPN1 and FtH mRNA expression. (B) Protein expression of FPN1 and H-Ft in spleen by Western blotting measurement. Expression values are normalized to β-actin and expressed as the mean ±standard deviation (n=3). **P<0.01. b) FPN1 expression in spleen tissue sections of normal mice measured by immunohistochemistry. There are more ferroportin1 expression in the red pulp of spleen in the Normal-CP group than that of Normal-Saline group. More FPN1 expression was found in the cytoplasm rather than on the plasma membrane of the cells (black arrow). Scale bar =50μm. c) Hepcidin mRNA expression in the spleen measured by Real-time PCR. There was more hepcidin mRNA expression in Normal-CP than that of Normal-Saline group by semi-quantification measurement. Data are means ±standard deviation (n=5), *P<0.05.