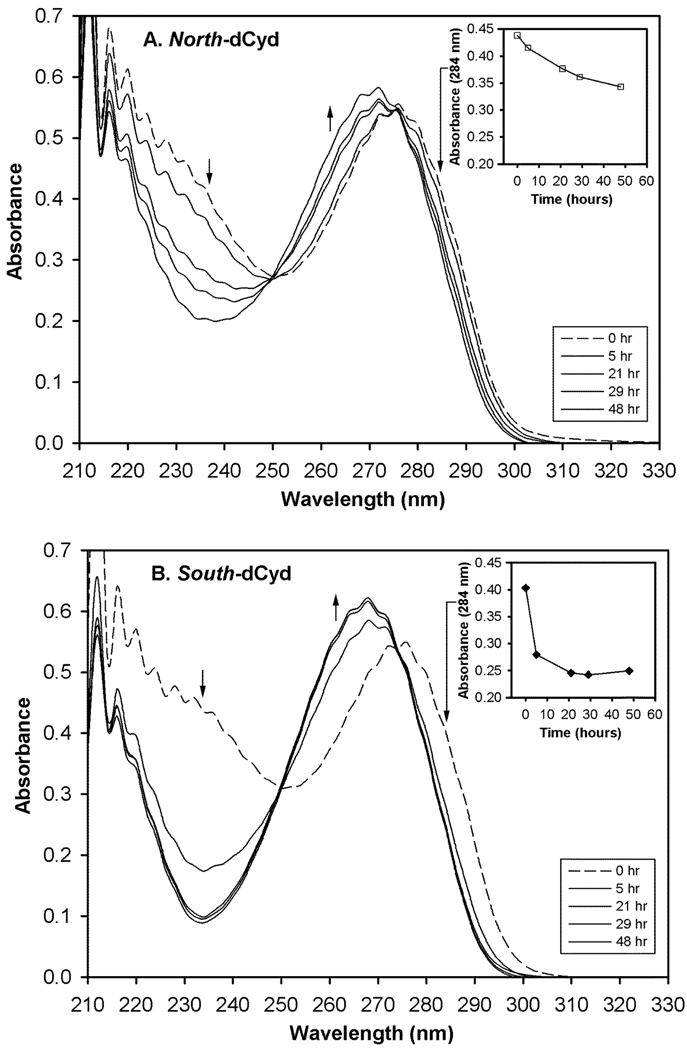
Figure 4.
Full UV spectrum for the enzymatic deamination of North- and South-dCyd over time. A clean isobestic point at 250 nm is maintained throughout the course of the reaction. The inset corresponds to the drop in absorbance at 284 nm (long arrow) as a function of time. The short arrows indicate either the increase (↑) or decrease (↓) in absorbance at that point over time. A) North-dCyd (□). B) South-dCyd (♦).

