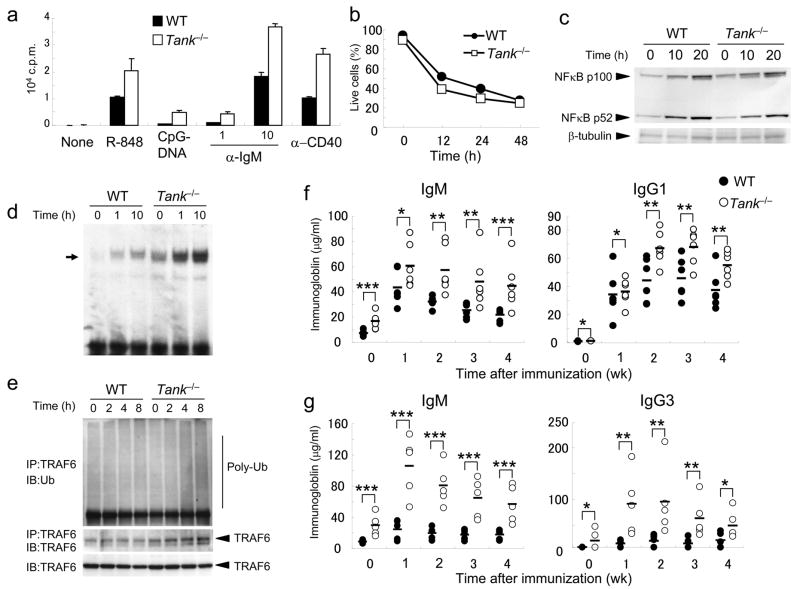
Figure 6. Enhanced activation of B cells in Tank−/− mice.
(a) Purified splenic B cells were cultured with R-848 (10 nM), CpG-DNA (10 nM), anti-IgM (1, 10μg/ml) or anti-CD40 (1 μg/ml) for 48 h. The samples were pulsed with [3H]-thymidine (1 μCi) for the last 16 h. [3H]-thymidine incorporation was measured using a β-scintillation counter. (b) Splenic B cells were cultured in the absence of cytokines for the indicated periods. The viability of the cells was determined by annexin V staining followed by flow cytometric analysis. (c) B cells from wild-type and Tank−/− mice were stimulated with 5μg/ml anti-CD40 for the indicated periods, and the processing of p100 to p52 in whole cell lysates was detected by immunoblot analysis. Immunoblots of β-tubulin are shown as a loading control. (d) B cells from wild-type and Tank−/− mice were stimulated with 5μg/ml anti-CD40 for the indicated periods. Nuclear extracts were prepared and the NFκB DNA-binding activity was determined by EMSA. The arrow indicates the induced NF-κB complex. (e) Cell lysates of splenic B cells treated with 5μg/ml anti-CD40 for the indicated periods were immunoprecipitated with anti-TRAF6, followed by immunoblot analysis with anti-Ub. Immunoblots of TRAF6 are shown as a loading control. The data shown are representative of three independent experiments. (f) Mice were immunized with nitrophenol-chicken γ-globulin, and nitrophenol (NP)-specific IgM and IgG1 production was measured by ELISA at 1, 2, 3 and 4 weeks after immunization. The data for 5 representative mice per genotype are shown. (g) Mice were immunized with trinitrophenol-Ficoll, and trinitrophenol (TNP)-specific IgM and IgG3 production was measured at 1, 2, 3 and 4 weeks after immunization. The data for 5 representative mice per genotype are shown. *, P > 0.05, **, P < 0.05 and ***, P < 0.01, versus Tank−/− mice.

