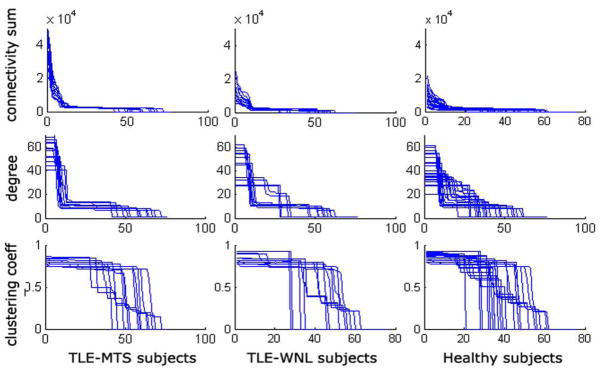
Figure 7.
Plots of 3 network metrics for 3 disease classes: TLE-MTS (left column), TLE-no (middle column) and Healthy (right column). Sum of outgoing connectivities for each node (top row), degree of each node (middle row) and clustering coefficient of each node (bottom row). No summary statistic was significantly different between groups except the scale difference of connectivity sum.

