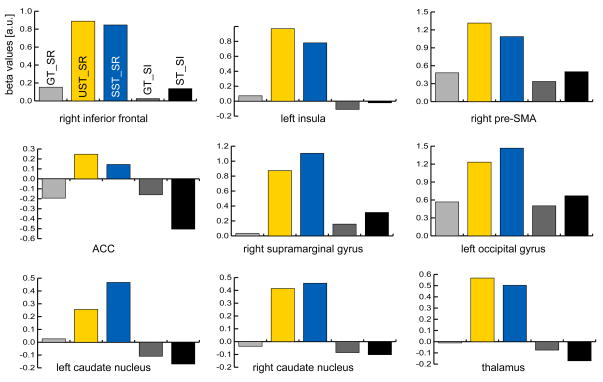
Fig. 5.
Results of the ROI analysis (beta values averaged across subjects). Parameter estimates were extracted from the activated clusters identified by the between-block conjunction that used Stop-irrelevant “Stop”-trials as the reference condition (see Tab. 5). Activity in none of these ROIs was significantly different between UST (yellow bars) and SST (blue bars).

