
Table 3.
The “connection” matrix between each pair of cortical regions.
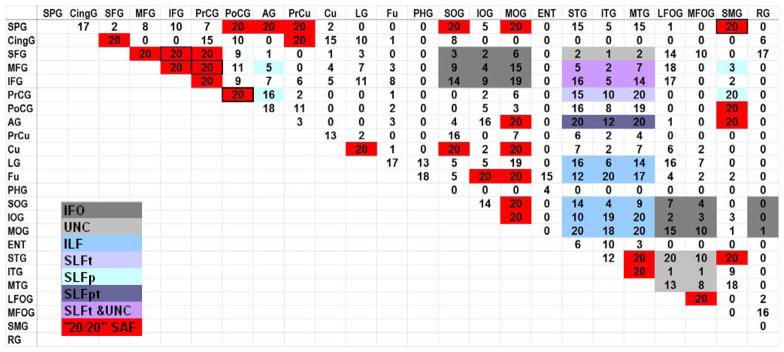 |
The numbers represent the number of subjects in which the connection was found. The color-coded boxes (except the red boxes) represent connections by known long association fibers. The red-filled boxes indicate the 29 short association fiber connections found, with “20/20” reproducibility. The boxes outlined in black are the four short association fibers previously reported by (Oishi et al., 2008).