
Figure 2.
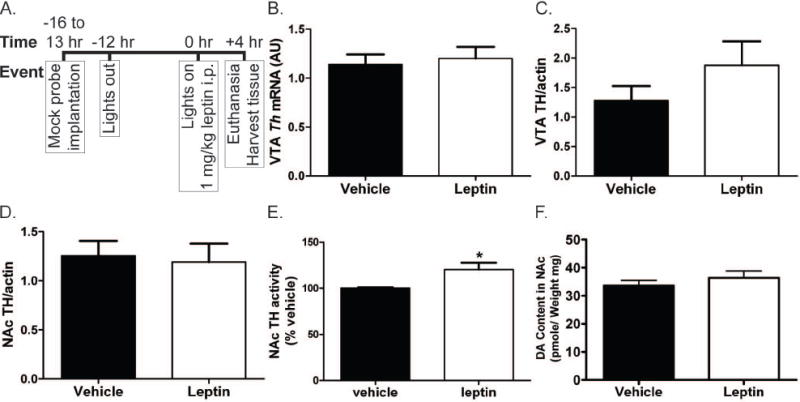
Procedure for tissue collection experiments and results for measurement of TH expression, TH activity, and total DA in tissue. All error bars represent SEM and treatment groups were compared by t test. (A) Protocol for animal treatment prior to tissue harvesting. The protocol was designed to mimic that used for the microdialysis experiments. (B) Expression of Th mRNA in the VTA as measured by qPCR. Vehicle n = 26. Leptin n = 24. (C) and (D) Expression of TH protein in the VTA(C) and NAc(D) as determined by quantified western blot. Actin band for used for standardization of the TH signal. Vehicle n = 6. Leptin n = 6. (E) Activity of TH in NAc collected from leptin or vehicle treated animals as measured by turnover of [3H]tyrosine. Vehicle n = 6. Leptin n = 5. * indicates p value < 0.05. (F) Total DA in the NAc measured by LC-EC. Vehicle n = 8. Leptin n = 9.