Figure 3.

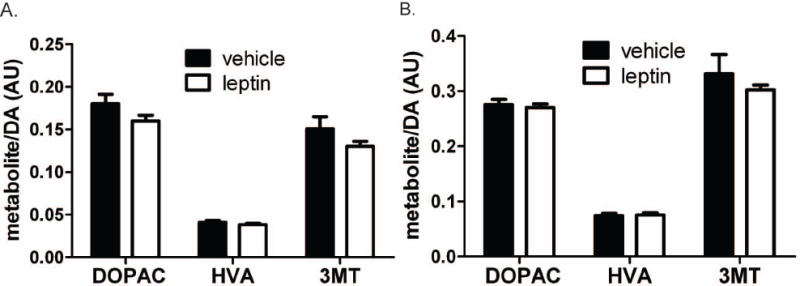
DA turnover in the NAc (A) and VTA (B). All error bars represent SEM and treatment groups were compared by t test. For all data, n = 9 except HVA in the NAc of leptin treated rats where n = 8.

DA turnover in the NAc (A) and VTA (B). All error bars represent SEM and treatment groups were compared by t test. For all data, n = 9 except HVA in the NAc of leptin treated rats where n = 8.