
Figure 4.
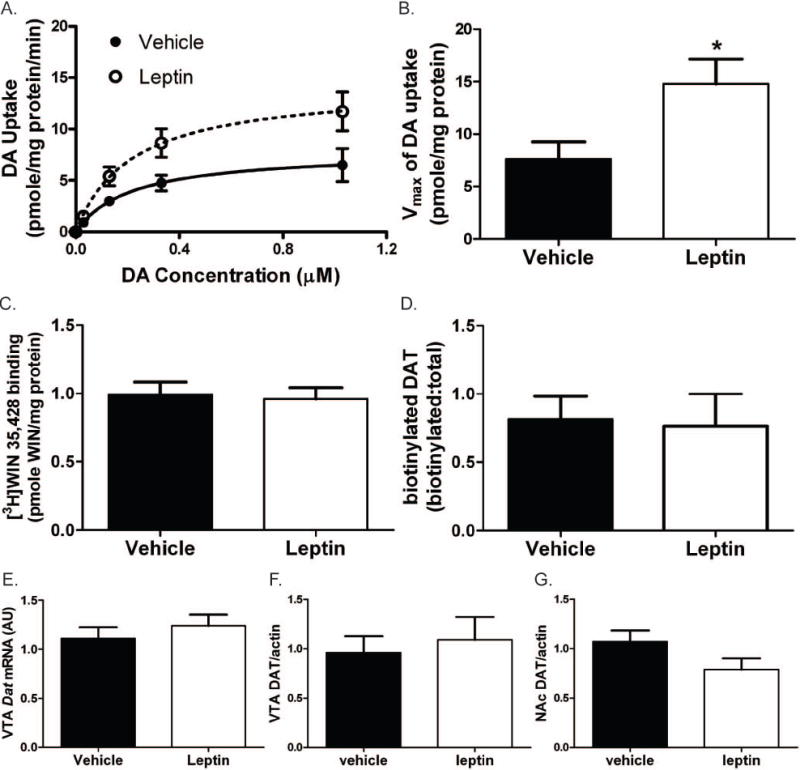
Results for measurement of DAT activity and expression. All error bars represent SEM and treatment groups were compared by t test. (A) DA uptake in the NAc as a function of [DA]. Vehicle n = 7. Leptin n = 8. DA uptake data were fit to the Michaelis-Menton equation. (B) The Vmax for DA uptake in tissue from the leptin treated animals was significantly greater than in vehicle treated animals. * indicates p value < 0.05. (C) DAT surface expression in the NAc as measured by [3H]WIN35428 binding. Vehicle n = 6. Leptin n = 6. (D) DAT surface expression as measured by biotinylation. Vehicle n = 5. Leptin n = 5. (E) Expression of Dat mRNA in the VTA as measured by qPCR. Vehicle n = 14. Leptin n = 14. (F) and (G) Expression of DAT protein in the VTA(F) and NAc(G) as determined by quantified western blot. Actin band for used for standardization of the DAT signal. Vehicle n = 6. Leptin n = 6.