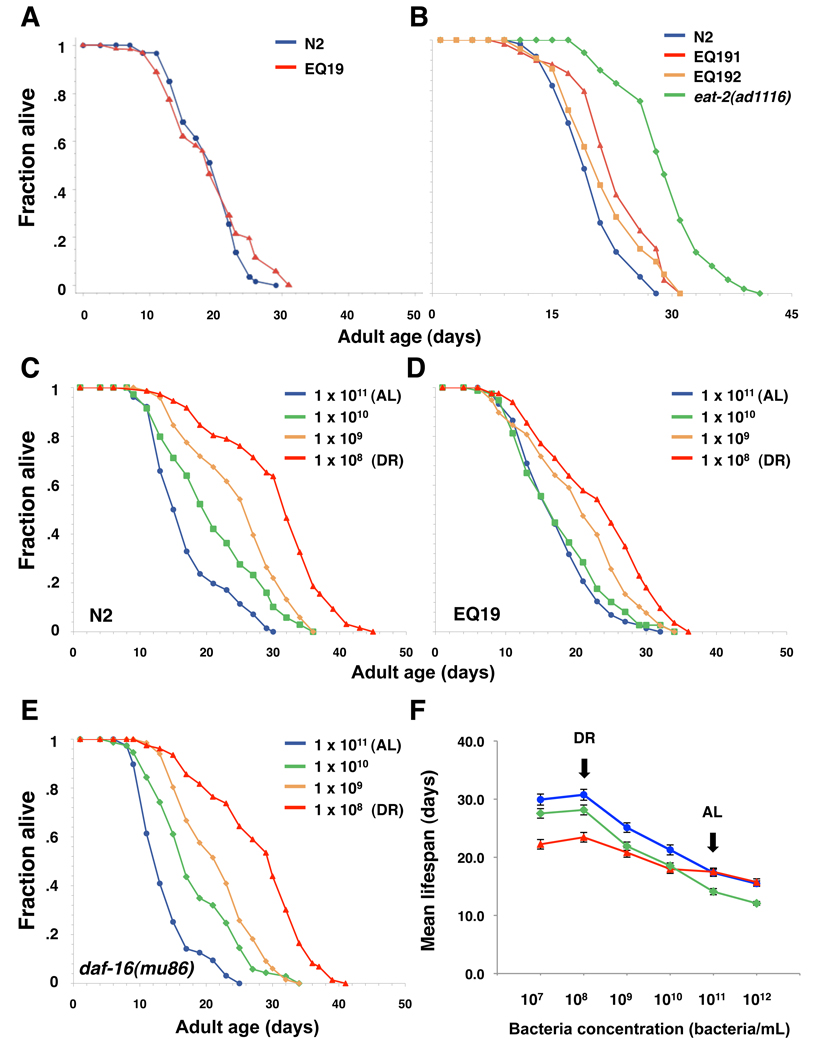
Fig. 3. eIF4H/DRR-2 is partially required for dietary restriction to extend lifespan.
(A) Survival curves of wild-type (N2) animals (blue line) or transgenic animals carrying additional copies of drr-2∷gfp (EQ19) (red line) at 20°C. Transgenic lines over-expressing DRR-2 without GFP tag were also obtained, and were found to have no effects on wild-type lifespan (Table S1). Please see Table S1 for statistical details, and for a repetition of this experiment. (B) Survival curves of wild-type (N2) animals (blue line), eat-2(ad1116) mutants (green line), or transgenic animals carrying additional copies of drr-2∷gfp in eat-2(ad1116) background (EQ191, EQ192) (red line) at 20°C. EQ191 and EQ192 were generated by crossing the drr-2∷gfp array into the eat-2(ad1116) mutant background from EQ19. (C–E) Survival curves of N2, daf-16(mu86) or transgenic animals over-expressing drr-2∷gfp (EQ19) grown on E coli at different concentrations (1 × 10⁷ to 1 × 10¹² bacteria/mL). 1 × 10¹¹ bacteria/ml was considered to be the ad libitum control. DR was initiated at day 1 of adulthood. Details of the solid plate DR protocol we utilized were described in method section. (F) Mean lifespan of N2, daf-16(mu86) or transgenic animals over-expressing drr-2∷gfp (EQ19) fed with E coli at different concentrations (1 × 10⁷ to 1 × 10¹² bacteria/mL). The drr-2 over-expressing animals show diminished lifespan extension under DR, while daf-16 mutants show similar degree of lifespan extension under DR when compared to AL. Please see Table S1 for statistical details, and for a repetition of this experiment.

