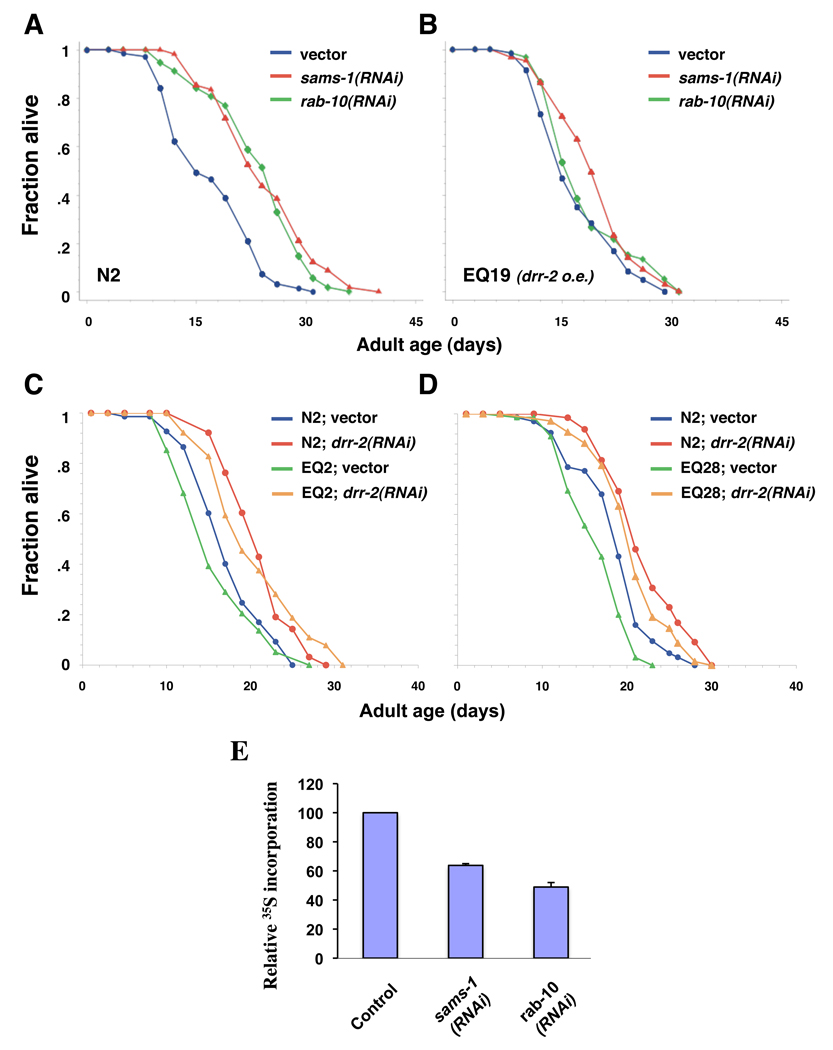
Fig. 5. Genetic interaction of eIF4H/drr 2 with sams-1 and rab-10.
(A–B) Over-expression of eIF4H/DRR-2 significantly suppresses the lifespan extension by sams-1 or rab-10 RNAi. Survival curves of wild-type (N2) animals or transgenic animals over-expressing drr-2∷gfp (EQ19) grown on either vector control bacteria (blue lines), sams-1 RNAi bacteria (red lines), or rab-10 RNAi bacteria (green lines) at 20°C. Please see Table S2 for statistical details, and for a repetition of this experiment. (C–D) Over-expression of sams-1 or rab-10 does not suppress the lifespan extension by drr-2 inhibition. Survival curves of N2 animals, or transgenic animals over-expressing either (C) sams-1∷gfp (EQ2) or (D) rab-10∷gfp (EQ28) grown on either vector control or eIF4H/drr-2 RNAi bacteria at 20°C. Please see Table S3 for statistical details, and for a repetition of this experiment. (E) Relative levels of 35S-methionine incorporation in 1-day-old wild-type (N2) adults fed with vector control, sams-1, or rab-10 RNAi bacteria from hatching. Bar graph represents mean incorporated 35S-methionine of three independent experiments normalized to total protein levels of the indicated RNAi treated animals compared to control animals; error bars represent standard deviation (STD). The p value for sams-1 RNAi, and rab-10 RNAi, when compared to vector control by paired t-test, are 0.036 and 0.004, respectively.

