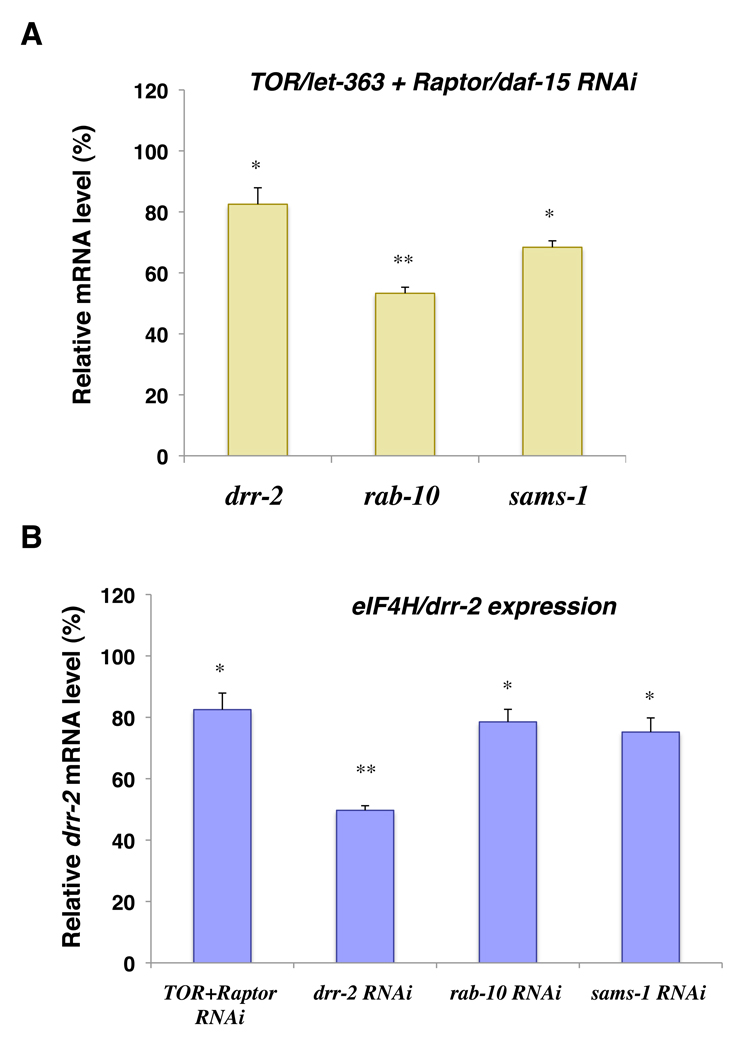
Fig. 6. Effects of TOR/Raptor, rab-10, and sams-1 RNAi on eIF4H/drr-2 expression.
(A) Relative mRNA levels of drr-2, rab-10, and sams-1 in animals fed with 1:1 mixture of TOR/let-363 and Raptor/daf-15 RNAi bacteria compared to those fed with control bacteria were measured by quantitative RT-PCR and the average of three different sample sets are shown. The relative mRNA levels were normalized against act-1 (beta-actin) levels. Error bars: ± STD. (B) Relative levels of drr-2 mRNA in animals fed with various RNAi bacteria compared to those fed with control bacteria. Average of three different sample sets are shown. Error bars: ± STD. *P < 0.05; **P < 0.01.

