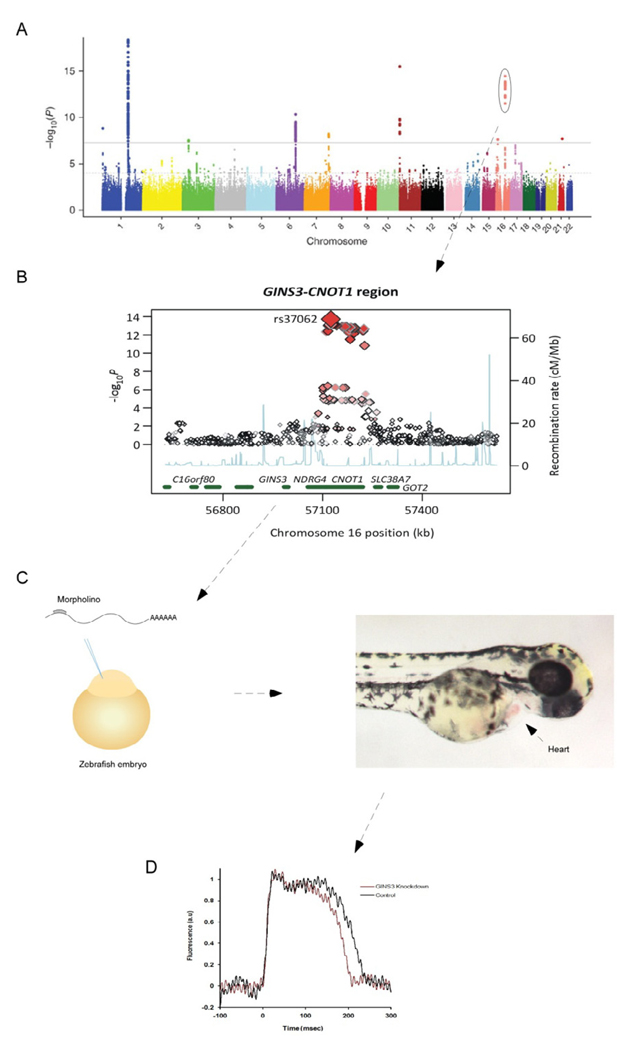
Figure 3. Functional characterization of a genetic locus for the QT interval.
Manhattan plot of SNPs associated with the QT interval with the GINS3 locus encircled (A). A regional plot of the GINS3 locus illustrating the SNPs associated with the QT interval (B). Genes in this region were knocked down in the zebrafish embryo by injecting a morpholino directed against GINS3 (C). Hearts from 48 hour old zebrafish were optically mapped and the action potential duration determined in wild-type and GINS3 morpholino knockout fish (D). Knockdown of GINS3 results in a shortening of the action potential duration. Panels A and B reprinted with permission from Nature Genetics 41, 399–406 (2009).

