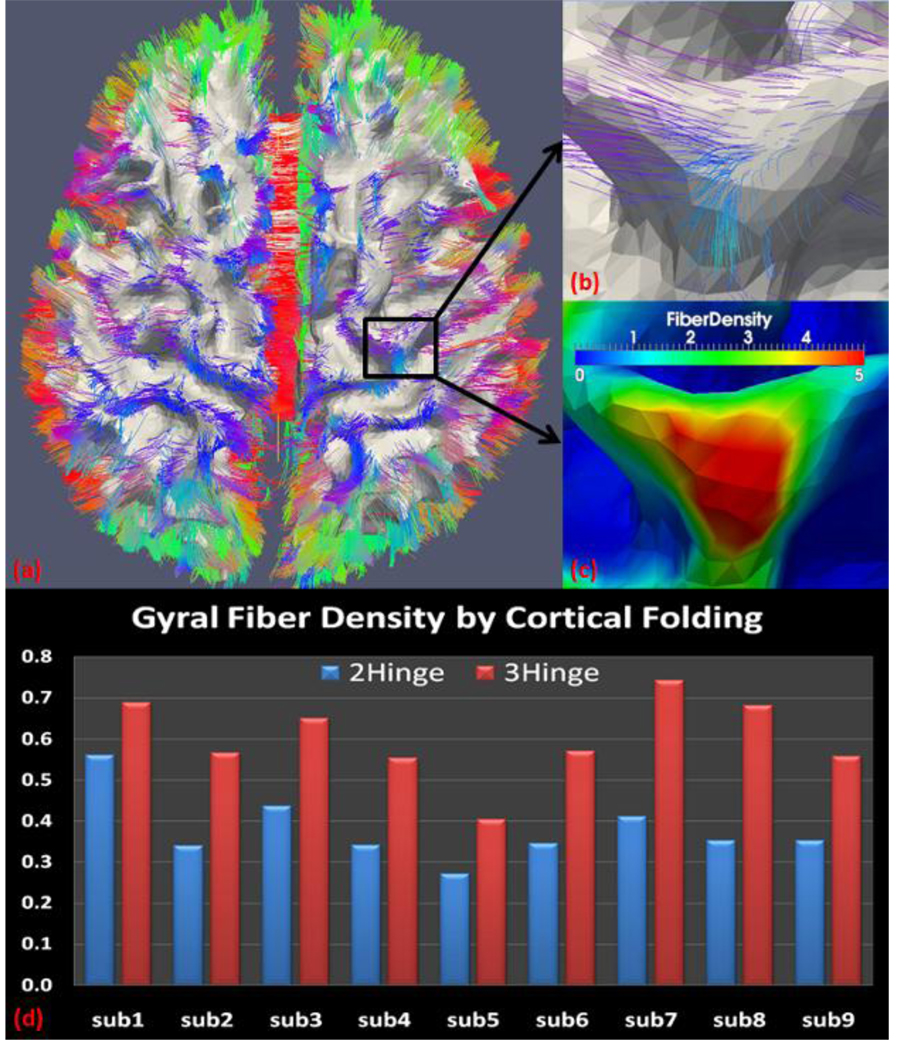
Figure 12.
Top: (a) Fiber overlaid on the WM/GM surface; (b) magnified view of the region in the black rectangular of (a); (c) fiber density of this region; (d) average fiber density of gyri with 2 hinges and 3 hinges for the whole dataset. Fiber density for 4-hinge gyri is not calculated since not every subject has this pattern in this dataset.

