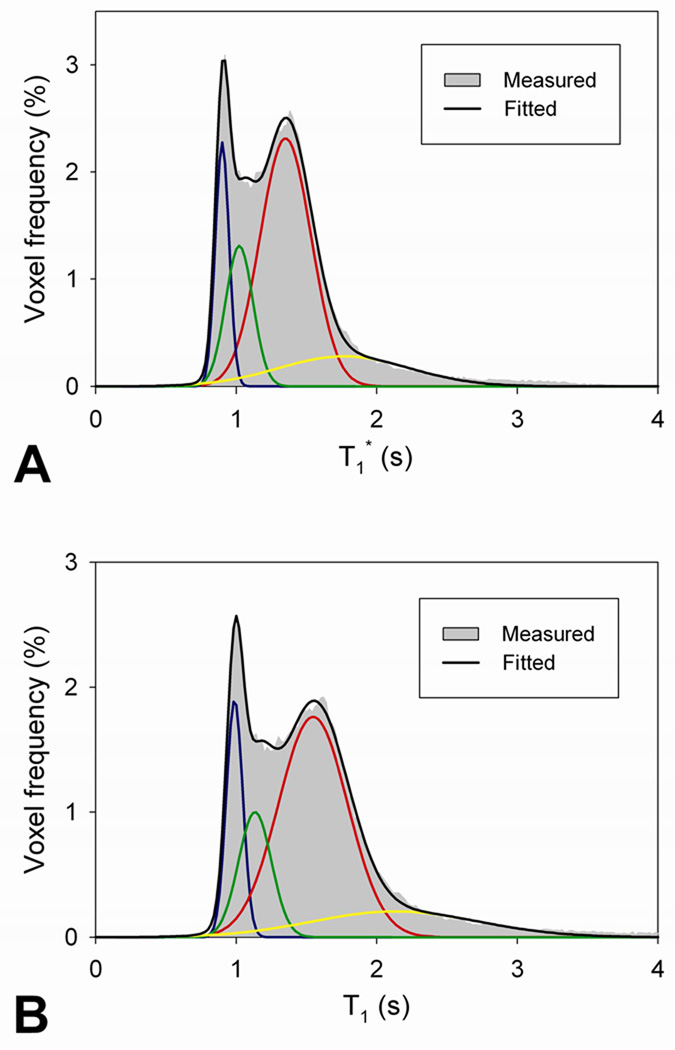
Fig. 1.
The representative T1* and T1 distributions in the whole brain. Voxel frequencies of T1* (A) and T1 (B) are distributed with a time interval of 20 ms, shown as gray shading. Four Gaussian functions are fitted to the distribution, representing WM (blue), GM (red), WM+GM (green), and GM+CSF (yellow). Black line indicates summation of the four Gaussian fitted curves.

