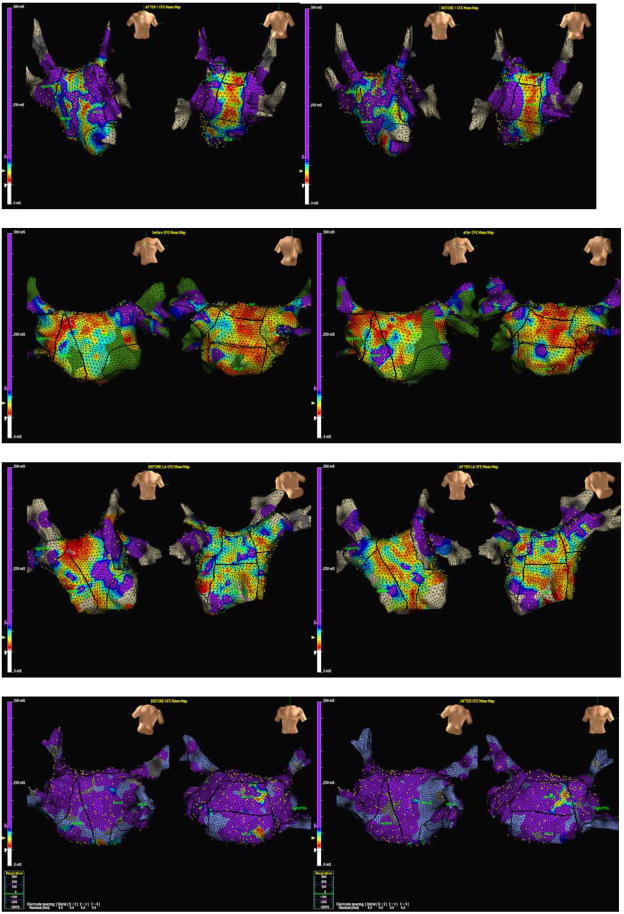
Figure 3. Fractionation maps before and after autonomic blockade.
Two typical examples demonstrating the difference in fractionation before and after pharmacological autonomic blockade. Panels A (before autonomic blockade) and B (after autonomic blockade) are from a patient with paroxysmal atrial fibrillation and a decrease in fractionation can be seen in panel B on the inferior left atrium (arrow).
Panels C (before autonomic blockade) and D (after autonomic blockade) are from a patient with persistent atrial fibrillation and a small decrease in fractionation can be seen in the anterior and posterior wall.

