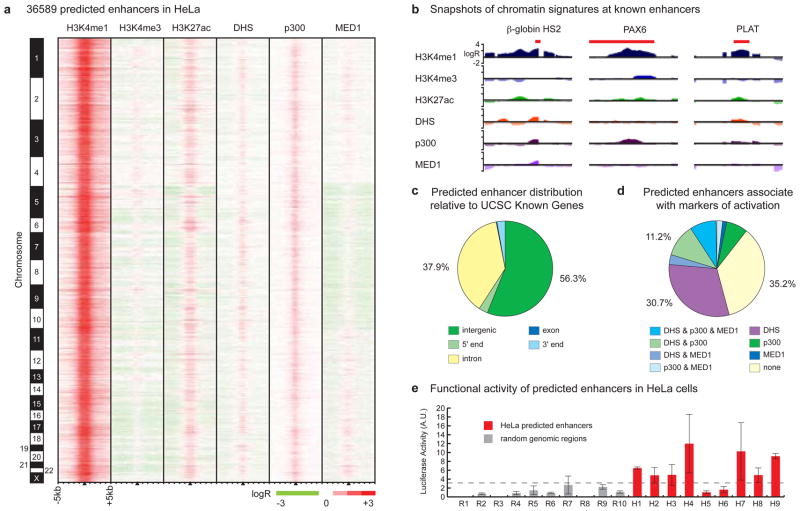
Figure 2. Genome-wide enhancer predictions in human cells.
(A) We predict 36589 enhancers in HeLa cells based on chromatin signatures for H3K4me1 and H3K4me3 as determined by ChIP-chip using genome-wide tiling microarrays and condensed enhancer microarrays (see Supplementary Information). Enhancer predictions are located at the center of 10 kb windows as indicated by black triangles, and ordered by genomic position. Enrichment data are shown for histone modifications (H3K4me1, H3K4me3, and H3K27ac), DNaseI hypersensitivity (DHS), and binding of p300 and MED1. (B) ChIP-chip enrichment profiles at several known enhancers (indicated in red) recovered by prediction: β-globin HS2 (chr11:5258371-5258665)11, PAX6 (chr11:31630500-31635000)12, PLAT (chr8:42191500-42192400)13 (5 kb windows centered on enhancer predictions; images generated in part at the UCSC Genome Browser). (C) Most enhancers have intergenic (56.3%) or intronic (37.9%) localization relative to UCSC Known Gene 5′-ends. (D) Most enhancers (64.8%) are significantly marked by DNaseI hypersensitivity, binding of p300, binding of MED1, or some combination thereof. (E) 7 of 9 enhancers predicted in HeLa cells were active in reporter assays (red bars) as compared to none of the random fragments selected as controls (gray), where activity is defined as relative luciferase value greater than 2.33 standard deviations (p = 0.01) above the median random activity (gray dashed line). Error bars represent standard deviation. Regions of ~1–2kb in size were randomly selected for validation in reporter assays based on histone modification patterns as in (A), overlap with features in (D), and sequence features amenable to cloning via PCR (see Supplementary Information).

