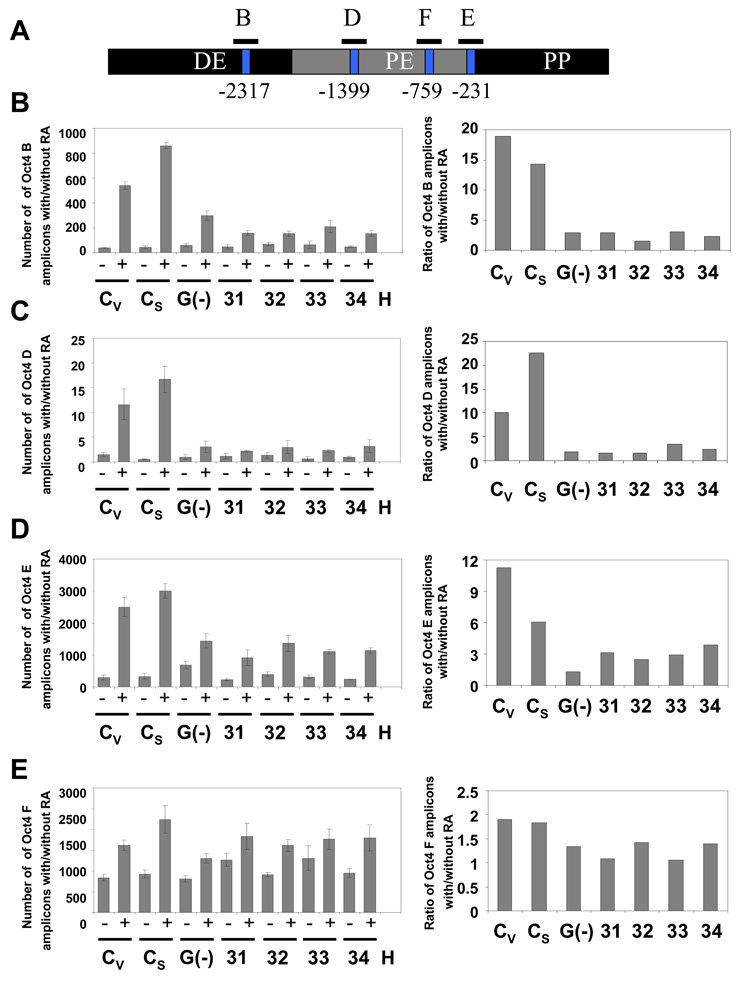
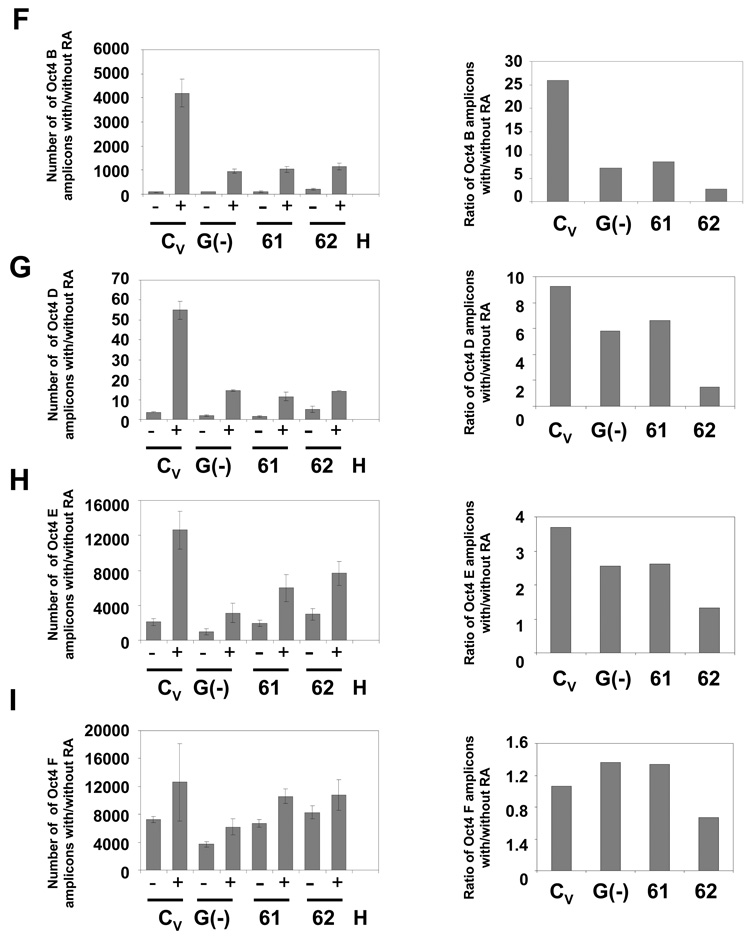
Fig. 4. Deficient DNA methylation of the Oct4 promoter in WRNp-deficient clones.
During the differentiation of NCCIT cells, Oct4 promoter DNA is progressively methylated and thus becomes resistant to the methylation-sensitive enzymes HpaII and HhaI. Cells were stimulated with 10 µM RA for 7 days then harvested, DNA extracted and digested with the methylation-sensitive enzymes HpaII or HhaI. The digested DNA was then subjected to real-time PCR with primers targeting segments of the Oct4 promoter that flank the restriction sites. Error bars indicate standard deviation. (A) Map of the Oct4 promoter with the location of the HpaII and HhaI restriction sites and DNA methylation sites (GeneBank No. AJ297527) and amplified Oct4 segments (B, D, E, and F). (B) CpG methylation status in the Oct4 B region of undifferentiated and RA treated WRNp-deficient, G9a-deficient and control cells (see Fig. 2 for terminology). The results are shown as the number of amplicons obtained with DNA from undifferentiated cells (−) as well as cells that were stimulated to differentiate with RA (+) (left panels). Right – a ratio of the number of amplicons detected in stimulated vs. non-stimulated samples (after adjustment to DNA input according to qPCR signal of undigested samples). (C) CpG methylation status in the Oct4 D region. (D) CpG methylation status in the Oct4 E region. (E) CpG methylation status in the Oct4 F region. (F) CpG methylation status in the Oct4 B region of undifferentiated and RA treated WRNp-deficient clones 61 and 62 and control cells. Cells were treated as in Fig. 4A-E. (G) CpG methylation status in the Oct4 D region of 61 and 62 clones. (H) CpG methylation status in the Oct4 E region. (I) CpG methylation status in the Oct4 F region of 61 and 62 clones. See Supplementary Figs. 2 and 3 for additional information.


