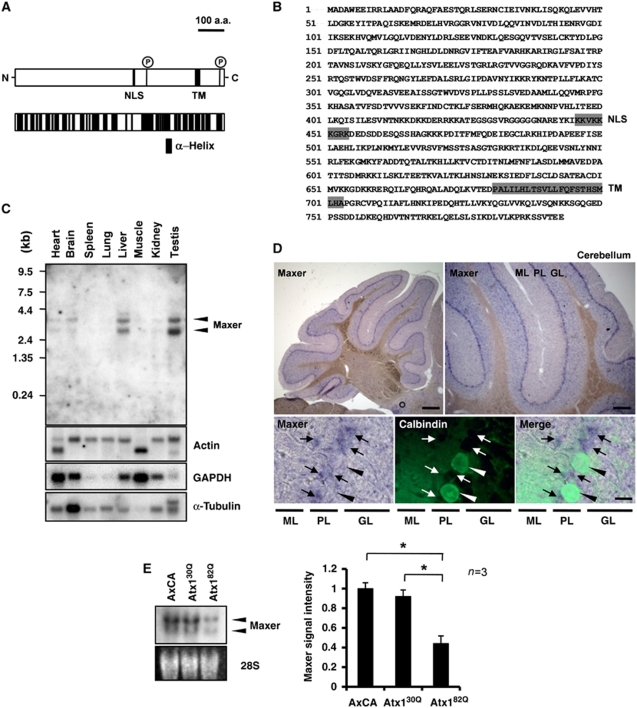
Figure 1.
Identification and tissue expression of Maxer. (A) Structure of Maxer protein. NLS, nuclear localization signal; TM, transmembrane domain; P, possible phosphorylation site. Lower scheme shows multiple α-helix (black). (B) Amino-acid sequence of rat Maxer. (C) Tissue expression profiles of Maxer mRNA in adult rat. Northern blot with full-length rat Maxer cDNA. (D) In situ hybridization analysis of Maxer at 8 weeks. Maxer is expressed at Purkinje cell layer (upper panels, purple). Lower panels are higher magnifications of co-staining with anti-calbindin antibody (green, arrowheads). Maxer is expressed in calbindin-negative cells (arrows), but not in calbindin-positive Purkinje cells. ML, molecular layer; PL, Purkinje cell layer; GL; granule cell layer. Bar: 200 μm (upper left), 100 μm (upper right) and 10 μm (lower). (E) Northern blot analysis of primary cerebellar culture prepared at P7. Cells were infected with AxCA (empty vector)-, AxCA-Atx130Q (Atx130Q)- or AxCA-Atx182Q (Atx182Q)-expressing adenovirus vectors. Maxer was reduced by mutant Atx1. The error bars represent s.e.m. n=3, *P<0.01, Student's t-test.

