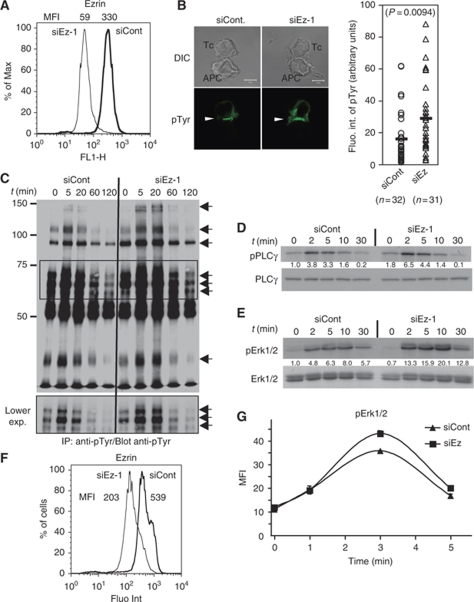
Figure 4.
Ezrin silencing leads to enhanced TCR-proximal signalling. (A–E) Jurkat J77 cells transfected with siRNA control or siRNA ezrin-1 were processed as follows: (A) Cells were fixed, stained with anti-ezrin Abs and analysed by flow cytometry. Mean fluorescence intensity of the peaks (MFI) is indicated above. Ezrin expression in ezrin-silenced cells was reduced by 80%. (B) Cells were activated with sAg-pulsed Raji cells for 20 min, set on coverslips, fixed and stained with anti-pTyr mAb (left). Fluorescence intensity of pTyr at the synapse was analysed by quantitative image analysis (right). (C) Cells were activated with sAg-pulsed Raji cells for 5, 20, 60 and 120 min. Cell lysates were immunoprecipitated with anti-pTyr mAb, and analysed by western blot using the same Ab. Arrows show major tyrosine phosphorylated polypeptides. The middle part of the blot (framed) is shown at a lower exposure in the lower panel. (D, E) Cells were activated with sAg-pulsed Raji cells for 2, 5, 10 and 30 min. Total cell lysates were analysed by western blot using Abs against the activatory tyrosine residue pTyr783 of PLCγ-1 (D, upper panel) and further revealed with anti-PLCγ-1 (D, lower panel). Alternatively, western blots were revealed with Abs directed to the activatory residues (Thr202/Tyr204) of Erk1/2 (E, upper panel) and further revealed with anti-Erk1/2 (E, lower panel). The density of bands corresponding to pPLCγ1 or pErk were normalized with respect to the amount of PLCγ1 or total Erk per lane, and then normalized to intensity of siCont at t=0. Values are indicated between the two blots. (F, G) Primary CD4 T cells transfected with siRNA control, or siRNA ezrin-1 were activated with soluble anti-CD3 Ab (MEM92) for the indicated times, fixed and stained with anti-ezrin (F) and pErk (G) Abs and analysed by flow cytometry. Mean fluorescent intensity of anti-ezrin staining is shown on the side of the histograms (F). Ezrin expression in ezrin-silenced cells was reduced by 60%. Mean fluorescence intensity of triplicates±s.d. of anti-pErk is plotted versus time. Note that s.d. bars in the curve points in (G) are small and hidden by the curve symbols. A representative experiment out of three independent experiments is shown.

