Figure 6.
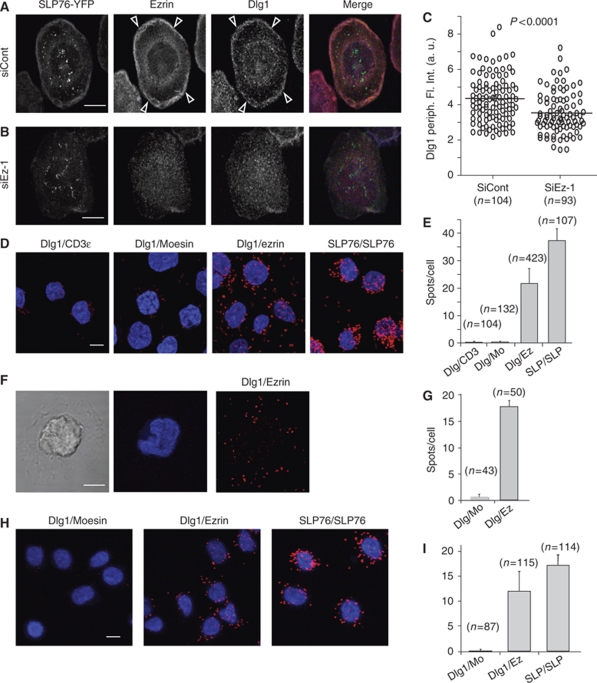
Ezrin interacts with Dlg1. (A, B) Jurkat J14 cells expressing YFP-SLP-76, transfected with siRNA control or siRNA ezrin-1, were activated 3 min on anti-CD3-coated coverslips, fixed, stained with anti-ezrin and anti-Dlg1 Abs and analysed by confocal microscopy. A confocal section at the contact surface is shown. Arrowheads point to the peripheral zone in which ezrin and Dlg1 are enriched. (C) Fluorescence intensity corresponding to Dlg1 staining at the periphery of the immunological synapse was quantified automatically as described in Materials and methods. (D) Jurkat J77 cells were adhered to poly-L-lysine coverslips, fixed and stained with pairs of antibodies as depicted in the figure: Dlg1-CD3ɛ (negative control), Dlg1-moesin, Dlg1-ezrin and two anti-SLP-76 Abs (positive control). The putative interaction of the molecules stained with each pair of Abs was then assessed using Duolink technology, as described in Materials and methods. Spots show molecular proximity and are indicative of molecular interactions. (F) Jurkat J77 cells were activated for 3 min on anti-CD3-coated coverslips. The interaction between Dlg1 and ezrin was assessed by Duolink and quantified as above (G). Moesin labelling was here the negative control. (H) Primary CD4 T cells adhered to poly-L-lysine coverslips, fixed and stained with pairs of antibodies as depicted in the figure: Dlg1-moesin, Dlg1-ezrin and two anti-SLP-76 Abs (positive control). (E, G, I) The spots per cell were automatically counted using BlobFinder software. Average values of number of spots/cell in different microscopy fields±s.d. is plotted. The number of cells analysed per condition is shown in parenthesis. One representative experiment is shown out of three carried out for (A–E) and of two for (F–I). Scale bar=5 μm.

