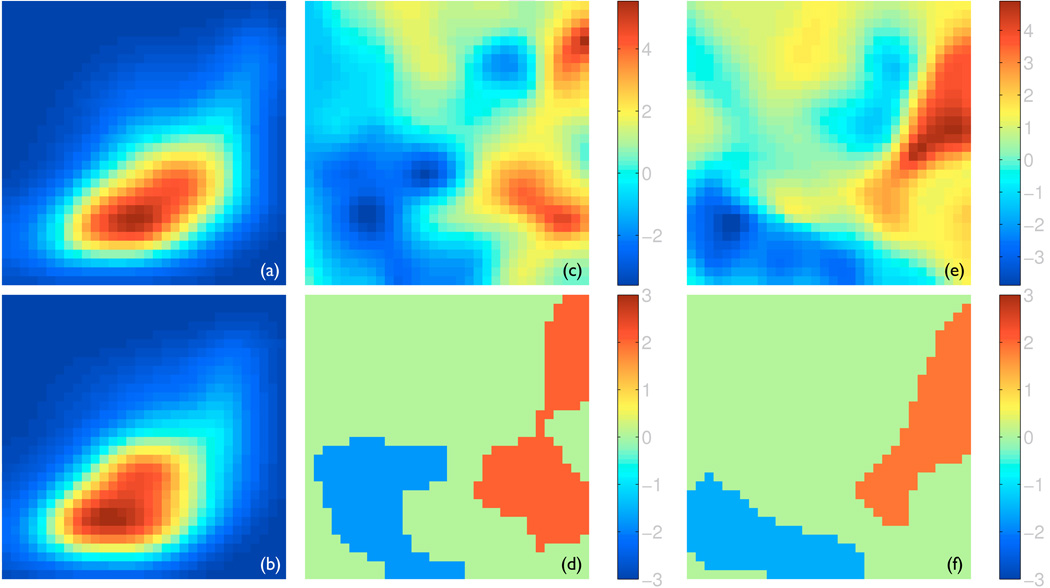
Figure 3.
The joint analysis of thickness and FA. In all panels, FA is plotted along the horizontal axis and varies from 0.1 to 0.7, while thickness is plotted along the vertical axis and varies from 0 to 8 mm. Both values are plotted in linear scale. Panels (a) and (b) show the joint probability density functions (pdf) of the left CST averaged for all the healthy controls and all the ALS patients, respectively, with the hot color corresponding to higher density. Panels (c) and (e) show the t-statistics maps of comparing the joint pdfs of the healthy controls to those of the ALS patients for the left and right CSTs, respectively. Panels (d) and (f) show the significant clusters with z-scores determined via permutation-based non-parametric testing for the left and right CSTs, respectively. The red clusters corresponds to larger density in the healthy controls and the blue clusters higher density in the ALS patients.

