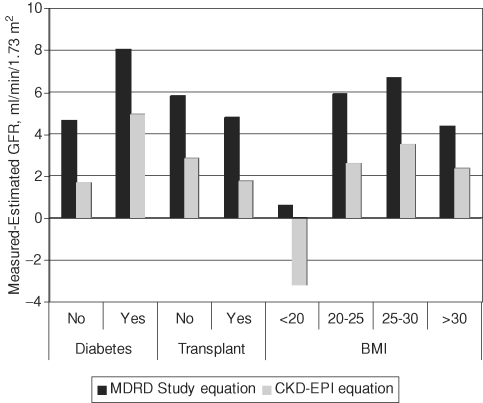
Fig. 1.
Comparison of performance for the MDRD study and CKD-EPI equations by subgroups. The comparison between the bias, defined as the difference between measured and estimated and between the MDRD study and CKD-EPI equations are shown across three subgroups: diabetes, solid organ transplant recipient and body mass index (<20, 20–25, 25–30 and >30 kg/m2).

