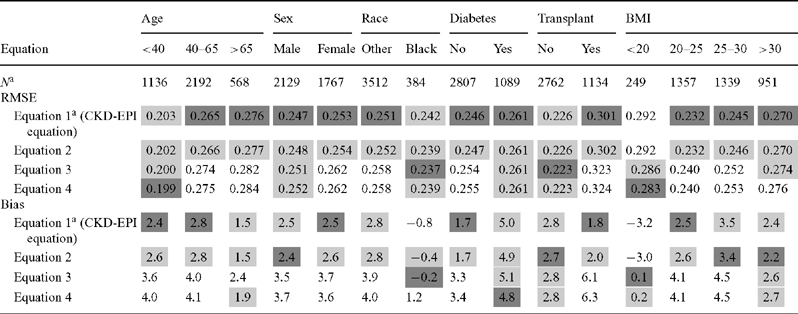
Table 6.
Comparison of equations by subgroups in the external validation dataset
 |
aSample size of each eGFR category determined from the CKD-EPI-1 equation.
Age is measured in years; BMI is measured in kg/m2.
The dark grey shaded cells in these tables indicate the equation with the best performance for that subgroup according to the point estimate for the metric, with the lighter grey shaded cells indicated those equations whose performance was similar to the best performing equation.
