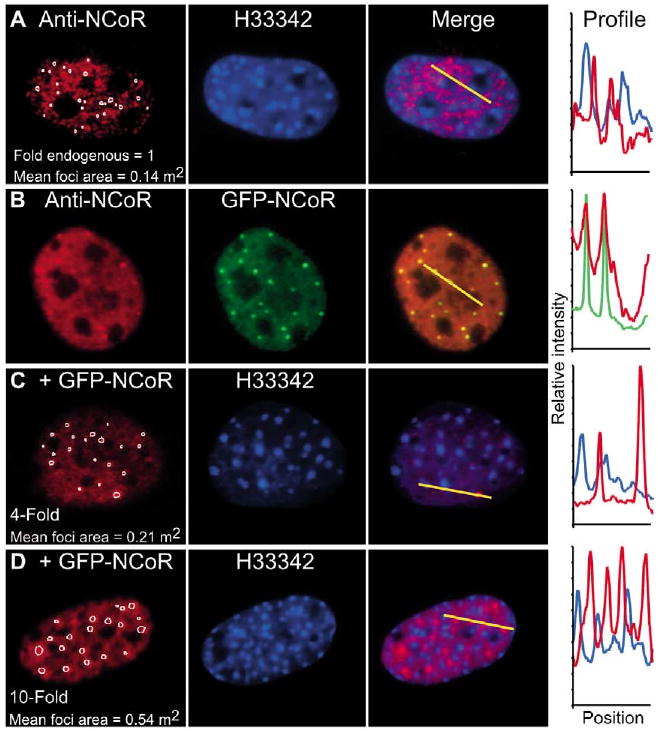
Fig. 1.

NCoR is localized to distinct subnuclear compartments. 3T3-L1 cells were fixed and subjected to ICC for detection of endogenous NCoR in (A) mock-transfected cells or (B-D) total NCoR in cells transfected with GFP-NCoR. Cells were stained with the H33342 chromatin dye. The profile plots (right) quantify the relative intensity of the fluorophores at the position along the yellow line in each overlay image. (B) The direct fluorescence signal from GFP-NCoR colocalized with anti-NCoR/Texas-Red immunofluorescence signal. (C,D) Representative images are labeled with the relative NCoR expression level based on the mean secondary-antibody/Texas-Red fluorescence intensity per nucleus. The computerized image-analysis algorithm automatically selected the foci (outlined in white) in each Texas-Red image. The mean area of the automatically selected foci is shown for each cell.
