
Fig. 2.
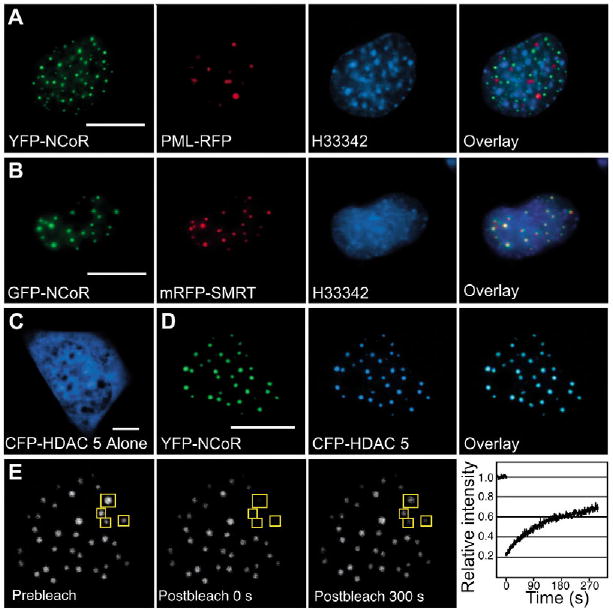
Co-repressors form specific intranuclear focal bodies. WFM images show living GHFT1-5 cells expressing: (A) both YFP-NCoR and RFP-PML, and stained briefly with the cell-permeant chromatin stain H33342; (B) both GFP-NCoR and mRFP-SMRT, and stained briefly with H33342; (C) CFP-HDAC-5 alone; or (D) YFP-NCoR and CFP-HDAC5 together. Each fluorescence channel is displayed separately and together in the overlay panel. Notice the different scale. Scale bars, 10 μm. (E) Living GHFT1-5 cells producing GFP-SMRT were subjected to FRAP analysis. The images show the nucleus of a cell taken at the same focal plane before selective photobleaching and at the indicated time points after. Fluorescence intensity in four foci was measured as indicated by the white square ROIs. The recovery plot shows the mean change in relative fluorescence intensity over a 300 second time frame, normalized to the prebleaching level for each ROI. Error bars denote s.e.m.