
Fig. 6.
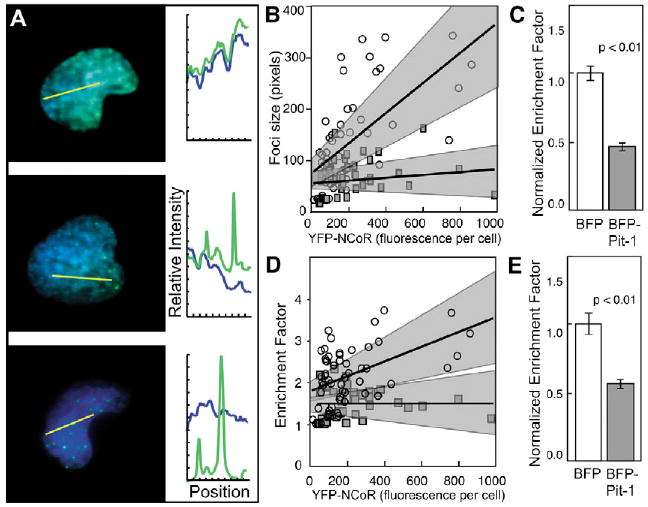
Pit-1 disperses NCoR foci in cell populations. Living cells were selected for WFM imaging using the mRFP signal, and subcellular ROIs were quantified using an automated computer algorithm to select ROI. The area and fluorescence intensity of each selected ROI were automatically measured, and the ratio of the surrounding region defines the enrichment factor (EF). (A) Overlay images of the YFP-NCoR and BFP-Pit-1 in three cells. The profile plots show the relative intensities of the fluorophores along the yellow line in each image. (B,D) Numerical results for 61 cells in the control population (open circles) and 48 cells in the experimental population (gray squares). Each point represents the mean data from a single cell. The relationships between YFP-NCoR expression level and (B) co-repressor focus size or (D) EF are shown. The black best-fit lines and 95% confidence intervals (surrounding gray regions) were calculated by linear regression for each population. The mean values of (C) focus size and (E) EF are shown normalized for expression level in each cell population.