
Fig. 2. Both Expressed and Endogenous Pit-1 Colocalized with C/EBPα.
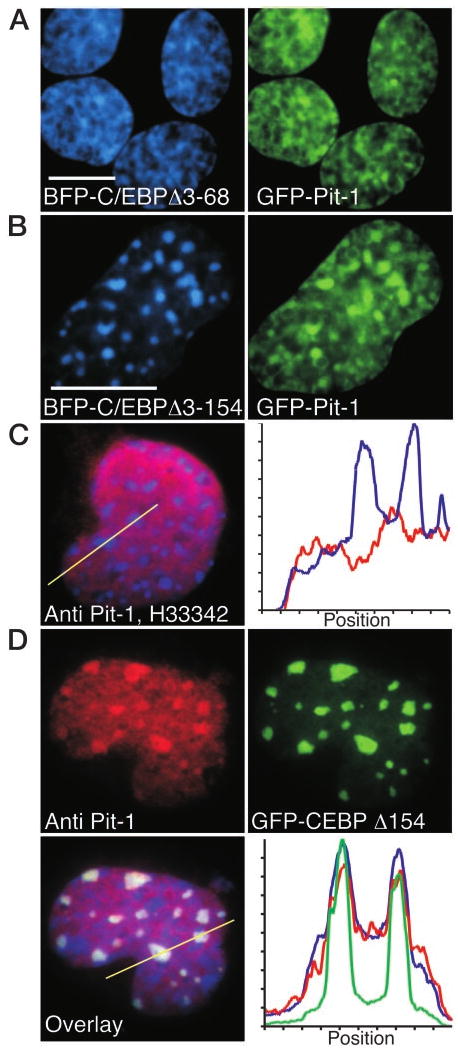
A and B, When coexpressed, GFP-Pit-1 recruited BFP-C/EBPΔ3–68, but not BFP-C/EBPΔ3–154, to the intranuclear domains occupied by Pit-1. Sequential images were acquired of GHFT1–5 cells coexpressing BFP-C/EBPΔ3–68 and GFP-Pit-1 (A) or BFP-C/EBPΔ3–154 and GFP-Pit-1 (B), as described in Materials and Methods. The calibration bars indicate 10 μm. C, Immunohistochemical staining of endogenous Pit-1 in a mouse GHFT1–5 cell. The endogenous Pit-1 was detected with antisera to Pit-1 and a Texas red-linked secondary antibody, and staining with H33342 revealed regions of heterochromatin. The red Pit-1 and blue H33342 fluorescence images were merged, and an intensity profile was obtained for both Texas red emission (red line) and H33342 fluorescence (blue line), and the position indicated by the line was plotted (right panel). D, Immunohistochemical detection of Pit-1 in a mouse GHFT1–5 cell expressing the truncated GFP-C/EBPΔ154. Staining for the endogenous Pit-1 was detected in the red channel, the expressed GFP-C/EBPΔ154 was detected in the green channel, and chromatin stained with H33342 was detected in the blue channel. The different fluorescence images were merged, and an intensity profile obtained for all three colors at the position indicted by the line was plotted (right panel).