
Fig. 5. Acceptor Photobleaching FRET Microscopy Detects the Interactions of Pit-1 and C/EBPα.
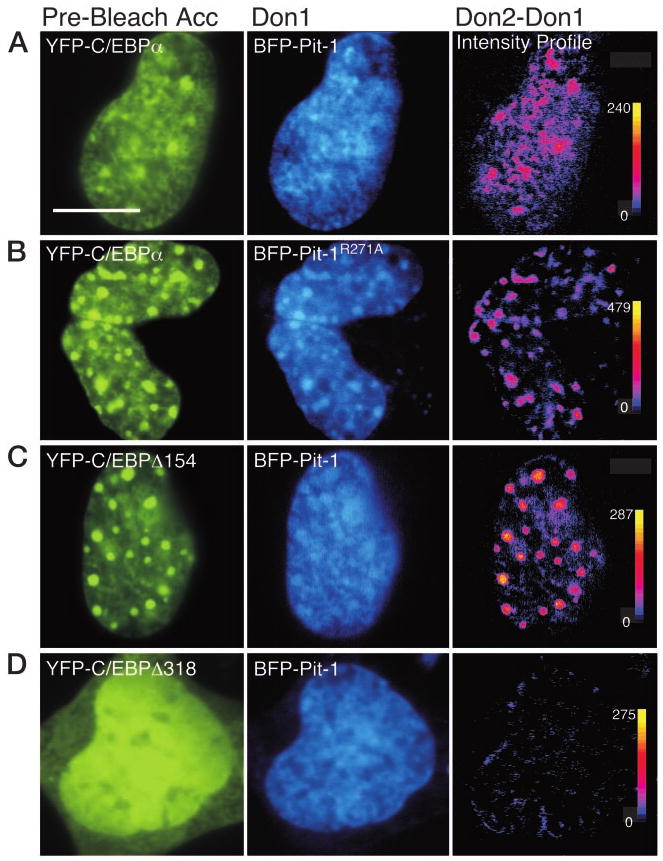
Prebleach acceptor (YFP) and donor (BFP) images are shown for each of the panels A–D. A second donor image (Don2) was acquired at the same focal plane and under identical conditions as the first (Don1) image after acceptor (YFP) photobleaching. The dequenched donor signal (Don2 − Don) was then determined as described in the legend for Fig. 4. For each dequenched donor image, the pixel-by-pixel change in gray-level intensity is shown in the intensity profile (right panels), with black indicating 0 and yellow indicating the maximum gray-level value (shown next to each calibration bar). A, The prebleach acceptor and donor images showing the recruitment of YFP-C/EBPα by BFP-Pit-1 (Don1); the bar indicates 10 μm. The dequenched donor (Don2 − Don1) intensity profile is shown in the right panel. B, The prebleach acceptor and donor images showing subnuclear distribution of YFP-C/EBPα and the mutant Pit-1R271A labeled with BFP (Don1). The dequenched donor (Don2 − Don1) intensity profile is shown in the right panel. C, The prebleach acceptor and donor images showing subnuclear distribution of YFP-C/EBPΔ154 and BFP-Pit-1 (Don1). The dequenched donor (Don2 − Don1) intensity profile is shown in the right panel. D, The prebleach acceptor and donor images showing subnuclear distribution of YFP-C/EBPΔ318 and BFP-Pit-1 (Don1). The dequenched donor (Don2 − Don1) intensity profile is shown in the right panel.