
Fig. 6. The FRET Efficiency (E%) for Paired Pit-1 and C/EBPα Protein Variants Measured in Multiple Cells.
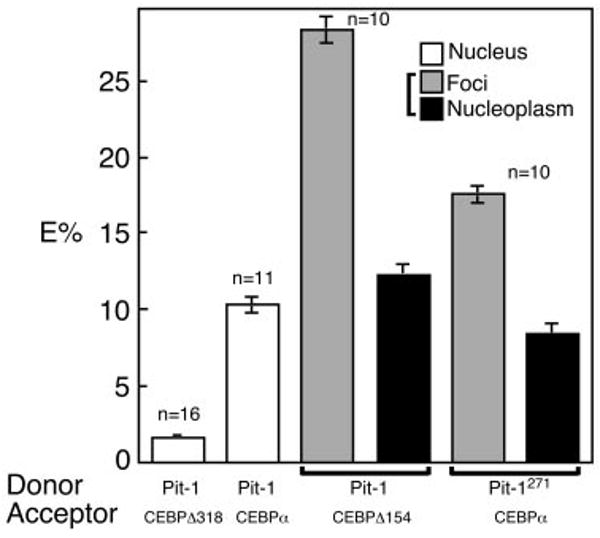
The indicated number (n) of cells, each expressing the donor and acceptor pairs shown below the graph, were analyzed for changes in donor fluorescence after acceptor photobleaching. For protein pairs distributed throughout nucleus (open bars), the average gray-level intensity was determined for the entire nucleus in both the pre- and postbleach donor images. The average E% (±sem) was then determined using the equation shown in the footnotes of Table 1. For protein pairs that were distributed to both foci and nucleoplasm, the average donor gray-level intensity was determined for 10 different ROIs in each region that were identically positioned in both the pre- and postbleach donor images. All ROIs were of identical size. The E% for the foci (gray bars) or nucleoplasm (black bars) in each cell was determined, and the average E% (±sem) for the indicated number of cells is plotted.