Figure 5.
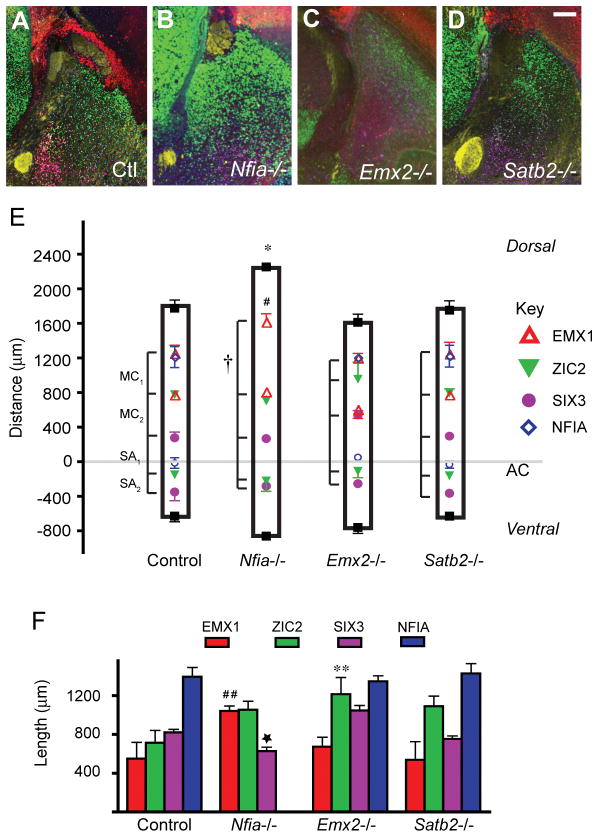
Commissural plate domains are disrupted in Emx2−/ − and Nfia−/−, but not Satb2−/ −mice. Fluorescence immunohistochemistry in the sagittal plane for GAP43 (yellow), EMX1 (red), ZIC2 (green) and SIX3 (magenta) reveals the anatomical and molecular features of the commissural plate in wildtype (A), Nfia−/ − (B), Emx2−/− (C), and Satb2−/ − mice (D). NFIA immunoreactivity is not shown here because measurements were taken from additional sequential, but not adjacent, sagittal sections that did not allow overlay. Loss of the CC is seen in Nfia−/− mice (B), where DHC and VHC dysgenesis is also apparent. Agenesis of the CC and HC is apparent in Emx2−/ − (C) and Satb2−/ − mice (D). The AC is enlarged in Satb2−/ − mice (D). E: Quantification of the commissural plate molecular boundaries as dorsoventral distances from the center of the AC. The MC, SA1 and SA2 domains are indicated to the left of the bars. Key to symbols: squares, dorsal and ventral surfaces of the brain; open upward triangles, EMX1; closed downward triangles, ZIC2; closed circles, SIX3. Wildtype littermates served as controls for the mutant mice. * p < 0.05 compared to the dorsal height of control. # p < 0.05 compared to the dorsal extent of EMX1 expression of control. † p < 0.05 compared to MC of control. F: Molecular domain lengths for each of the mouse strains. Domain length calculations were based on linear distance along the oblique angle of the commissural plate, as demonstrated in Supp. Fig. 2. ## p < 0.05 compared to EMX1 of control. ** p < 0.05 compared to ZIC2 of control. Star = p < 0.05 compared to SIX3 of control. Scale bar = 150 μm.

